At a glance
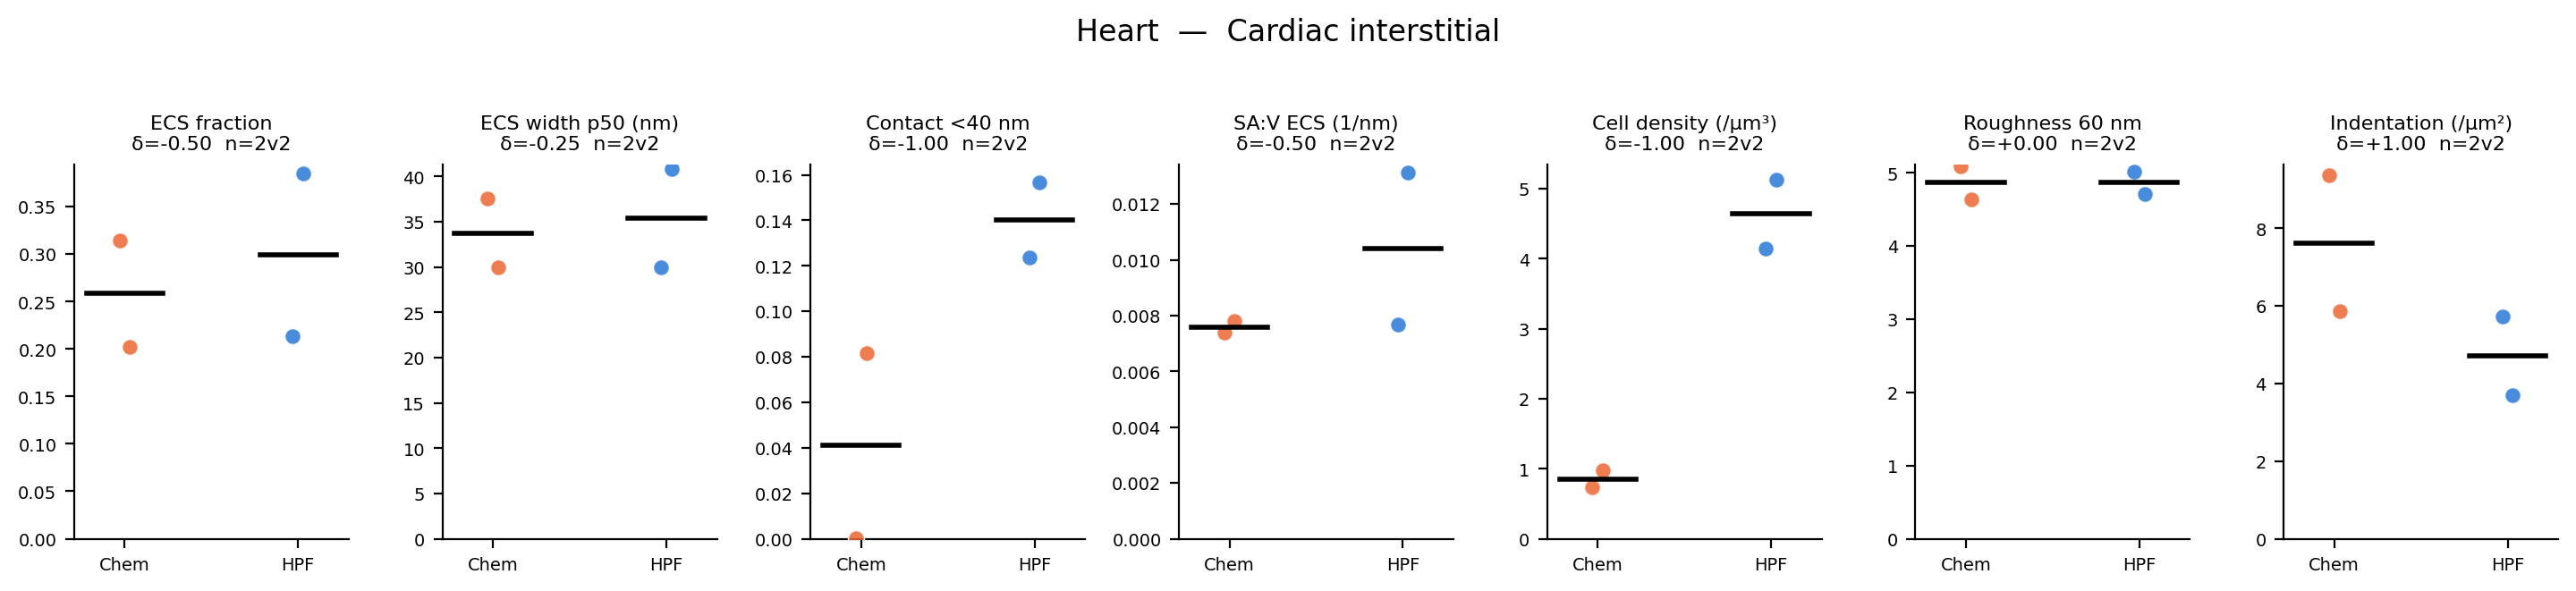
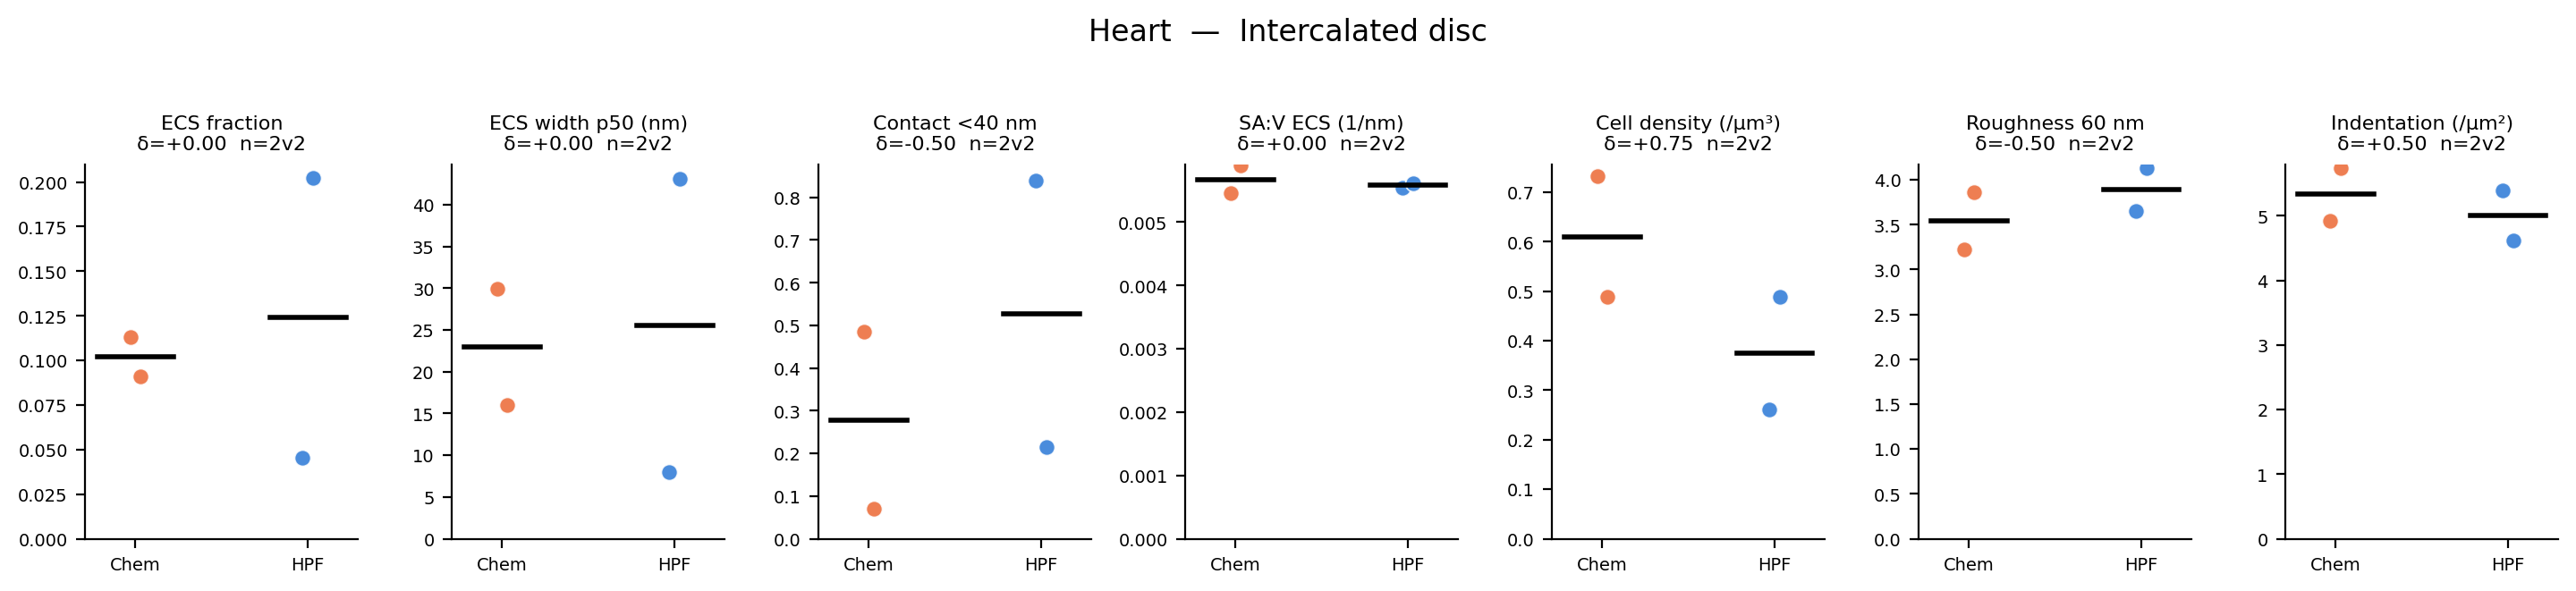
One card per headline metric: each dot a crop, chemical above and rapid HPF below, medians ticked. The bar is Cliff's δ, drawn from the centre — longer means the two preparations separate further. Click a card to open that metric in full. What δ means.
One metric at a time
Pick any of the 60-odd measurements above. Each dot is one crop — chemical on the upper line, rapid HPF on the lower — and the thick tick is that arm's median. Groups share one scale so they can be read against each other.
Loading…
The standing panels for this family
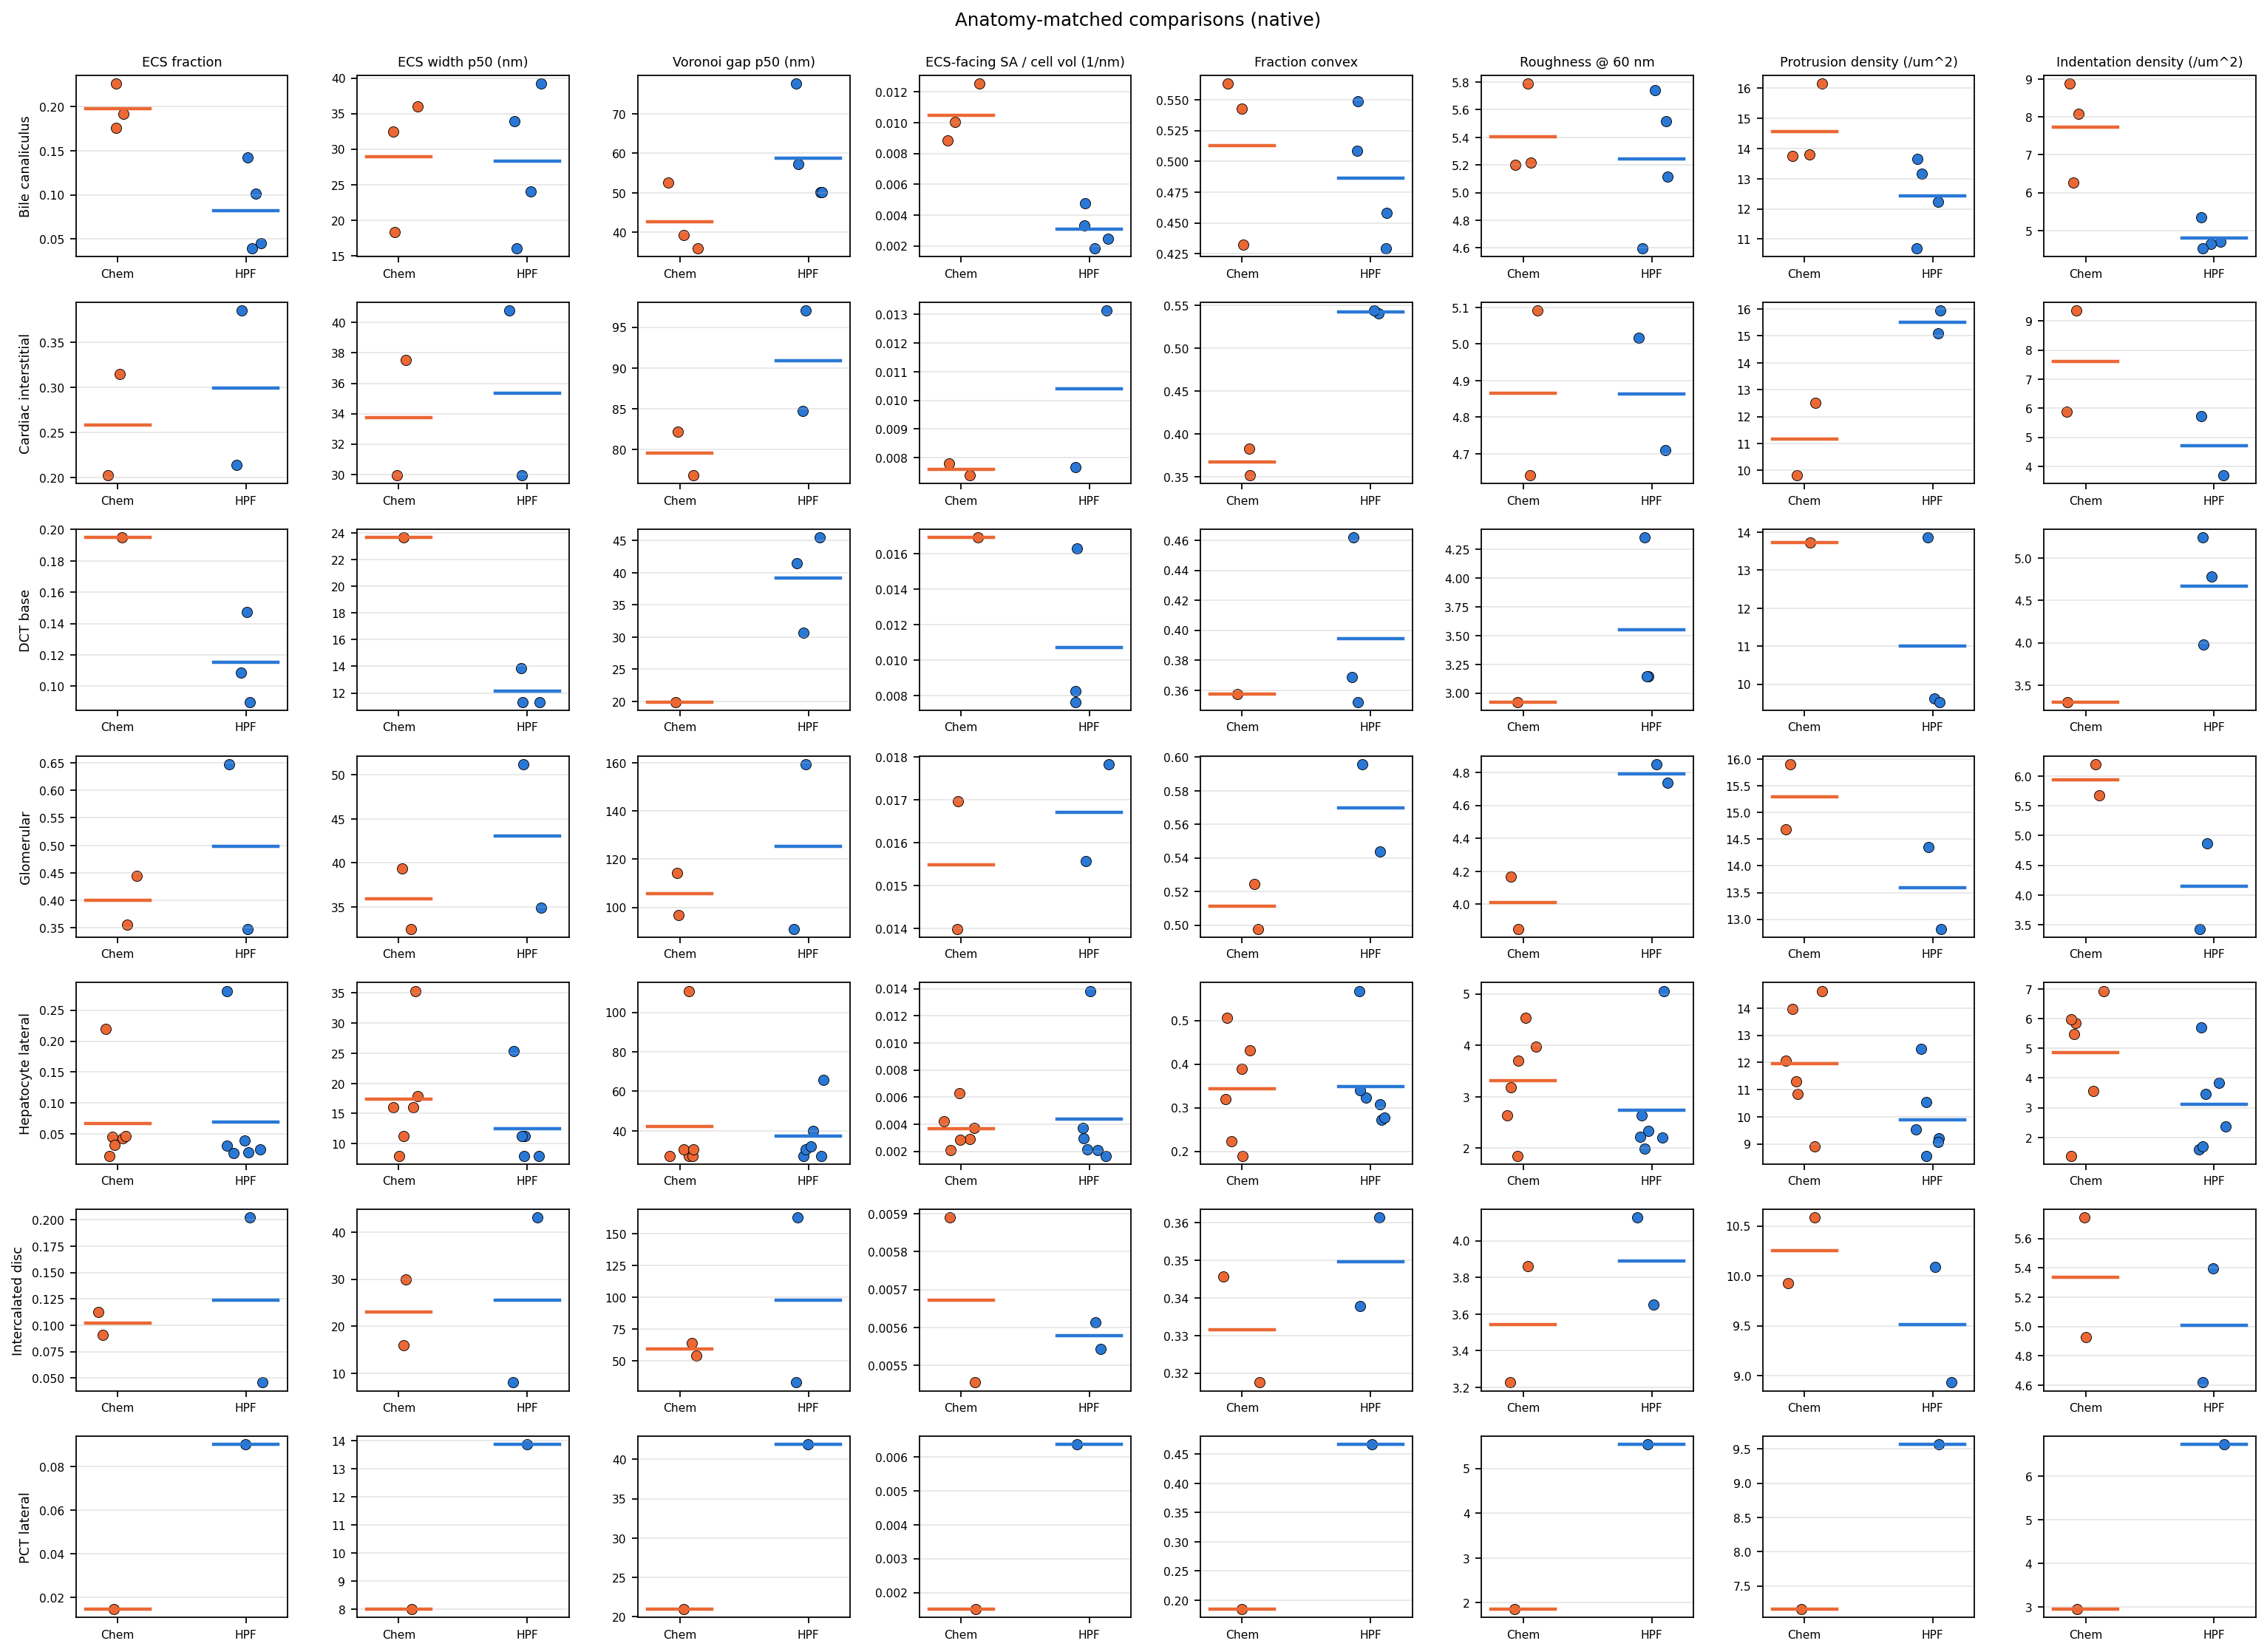
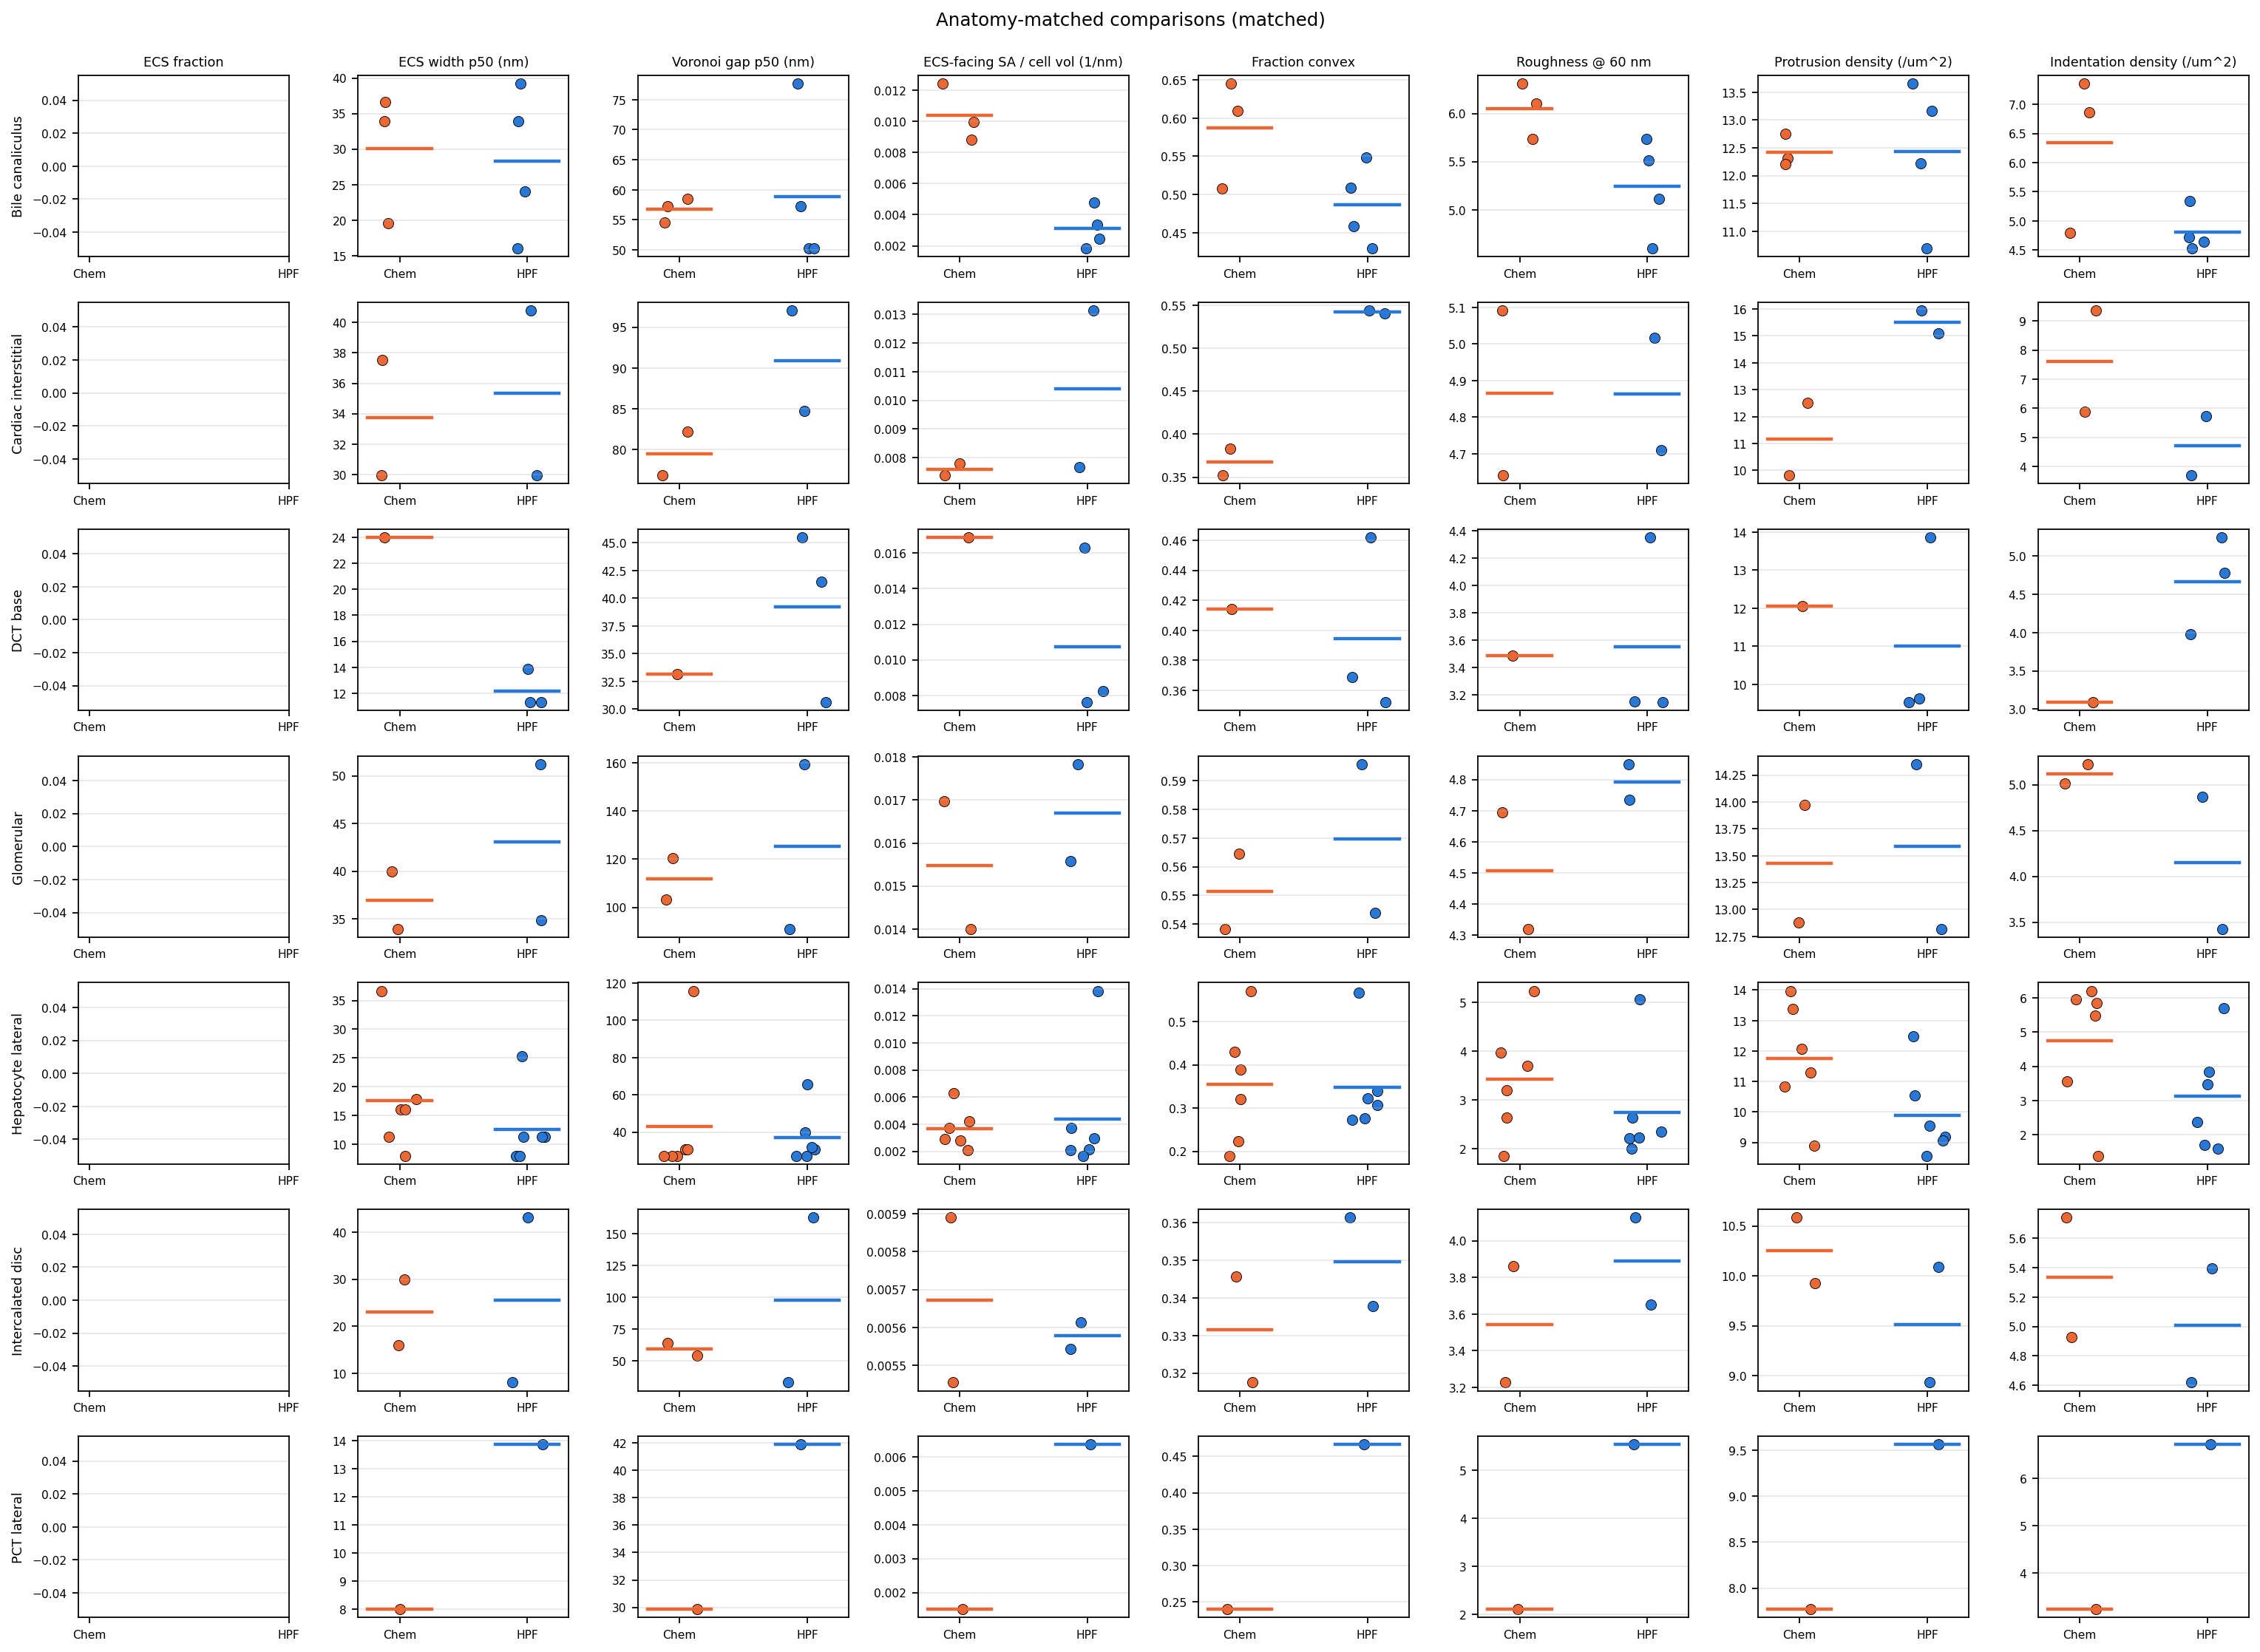
Pre-rendered by the pipeline, one for each resolution. The matched panel exists to be read against the native one: a difference that survives downsampling to 8 nm is not explained by voxel size. These change with the family above.
Volume fraction
ECS and cell volume fractions per crop. The most resolution-robust family, so the native panel can be read fairly directly. Native only: the matched run reads zarr metadata that is valid at native resolution alone.
Draw this live — any metric in the family, any grouping, one dot per crop.
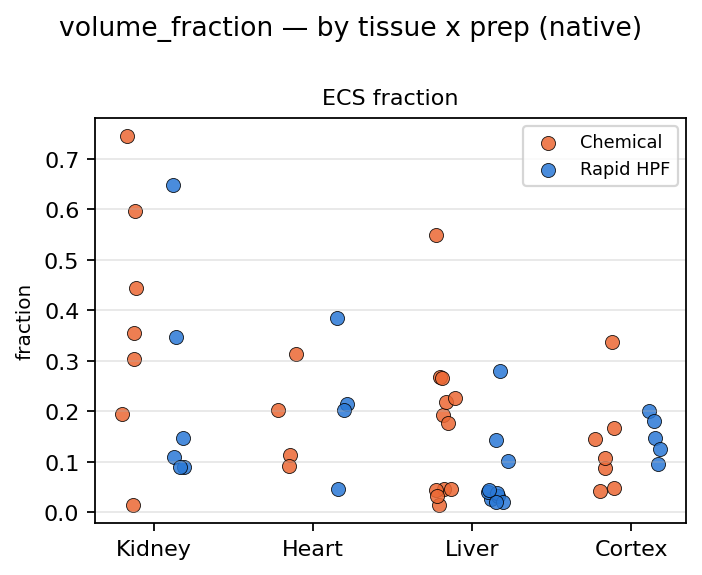 Full size ↗
ECS width
Distance from each extracellular voxel to the nearest cell. Distance to the wall, not channel width — roughly a quarter of it.
Draw this live — any metric in the family, any grouping, one dot per crop.
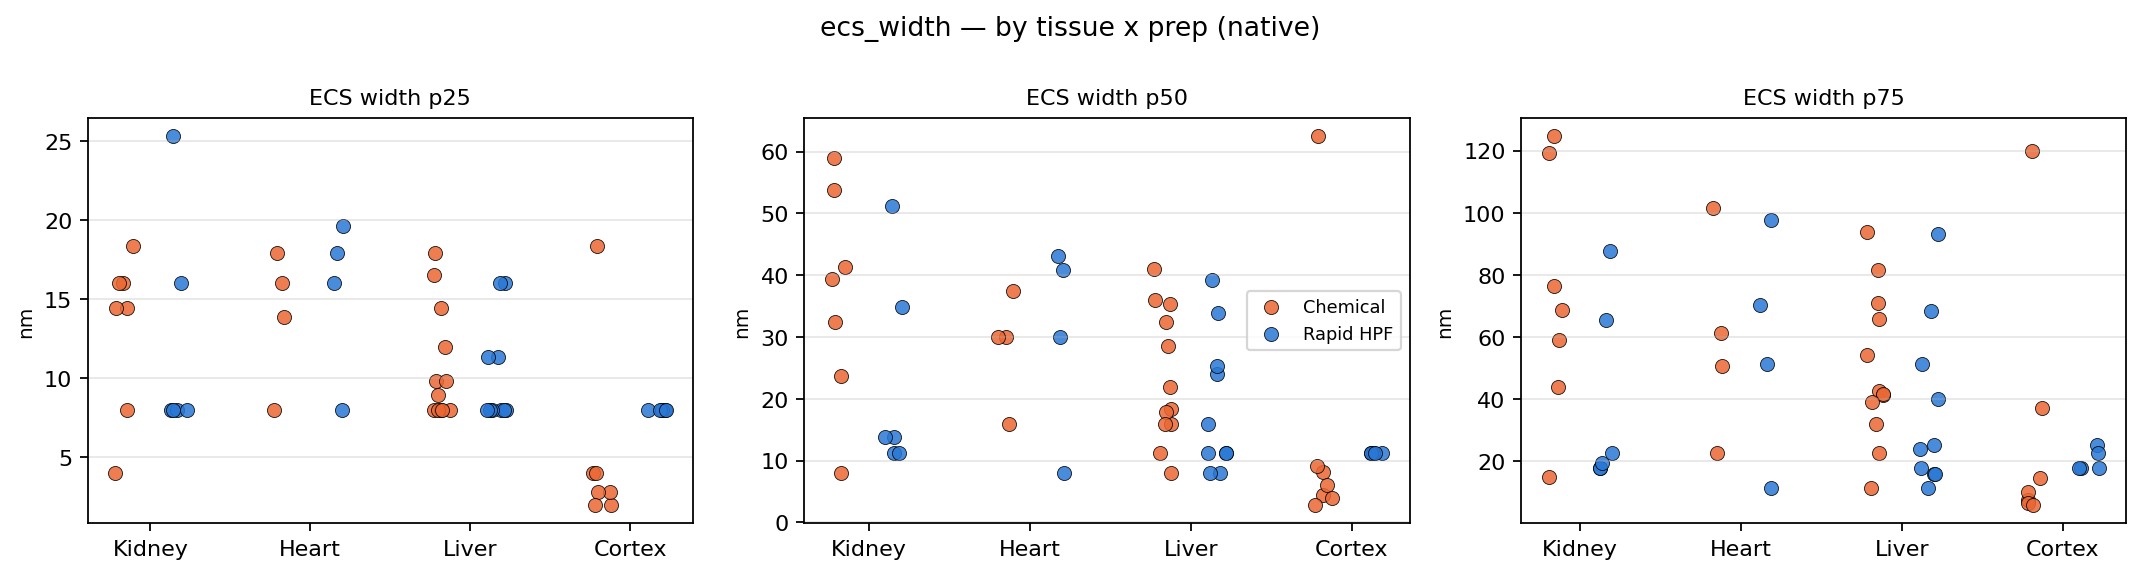 Full size ↗
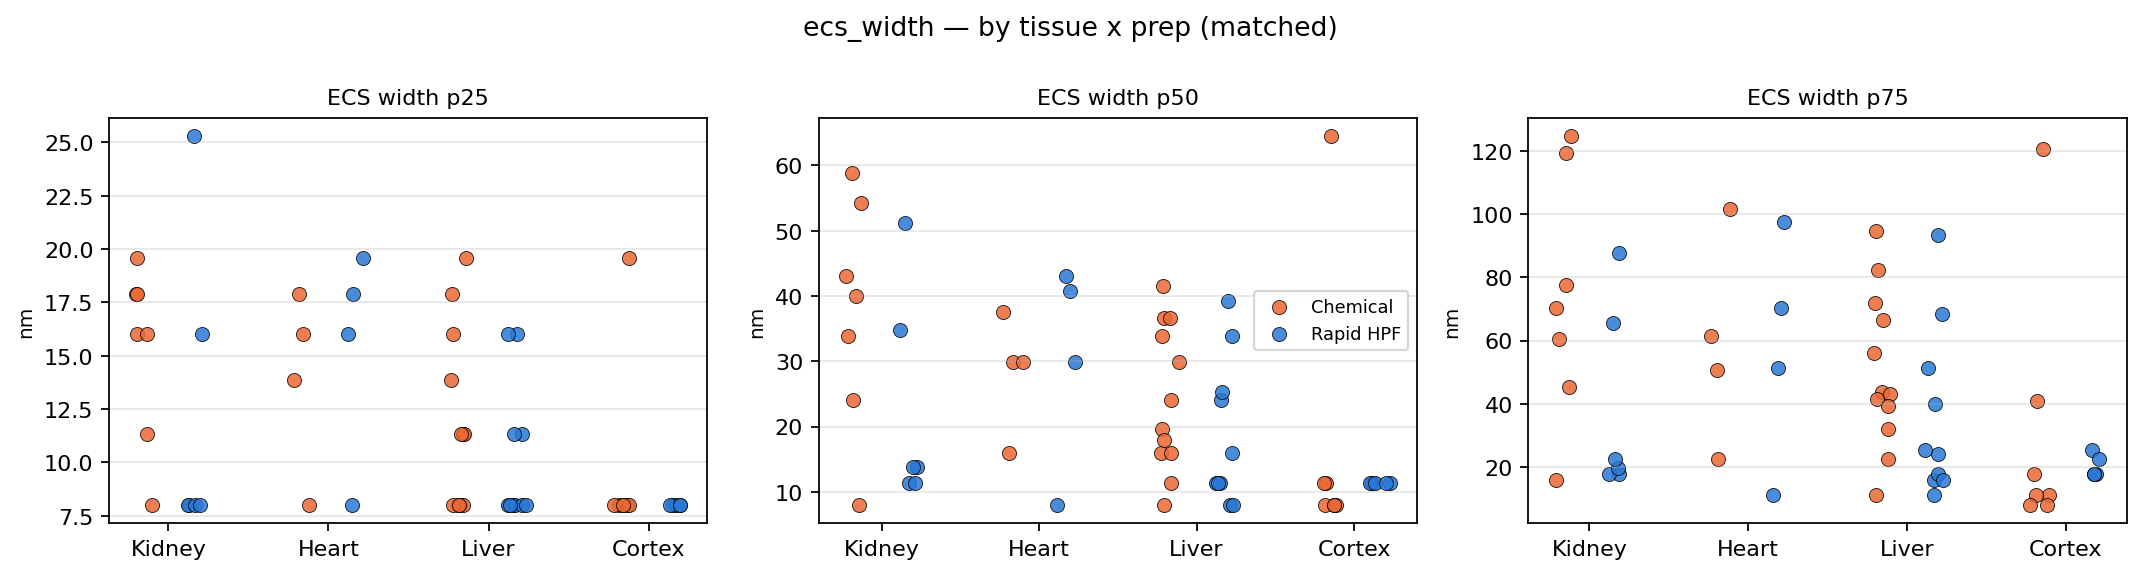 Full size ↗
Cell-to-cell gap
Gap between neighbouring cells. Hard floor of three voxels, so the left tail is the measurement, not the tissue; at 8 nm that floor is 24 nm.
Draw this live — any metric in the family, any grouping, one dot per crop.
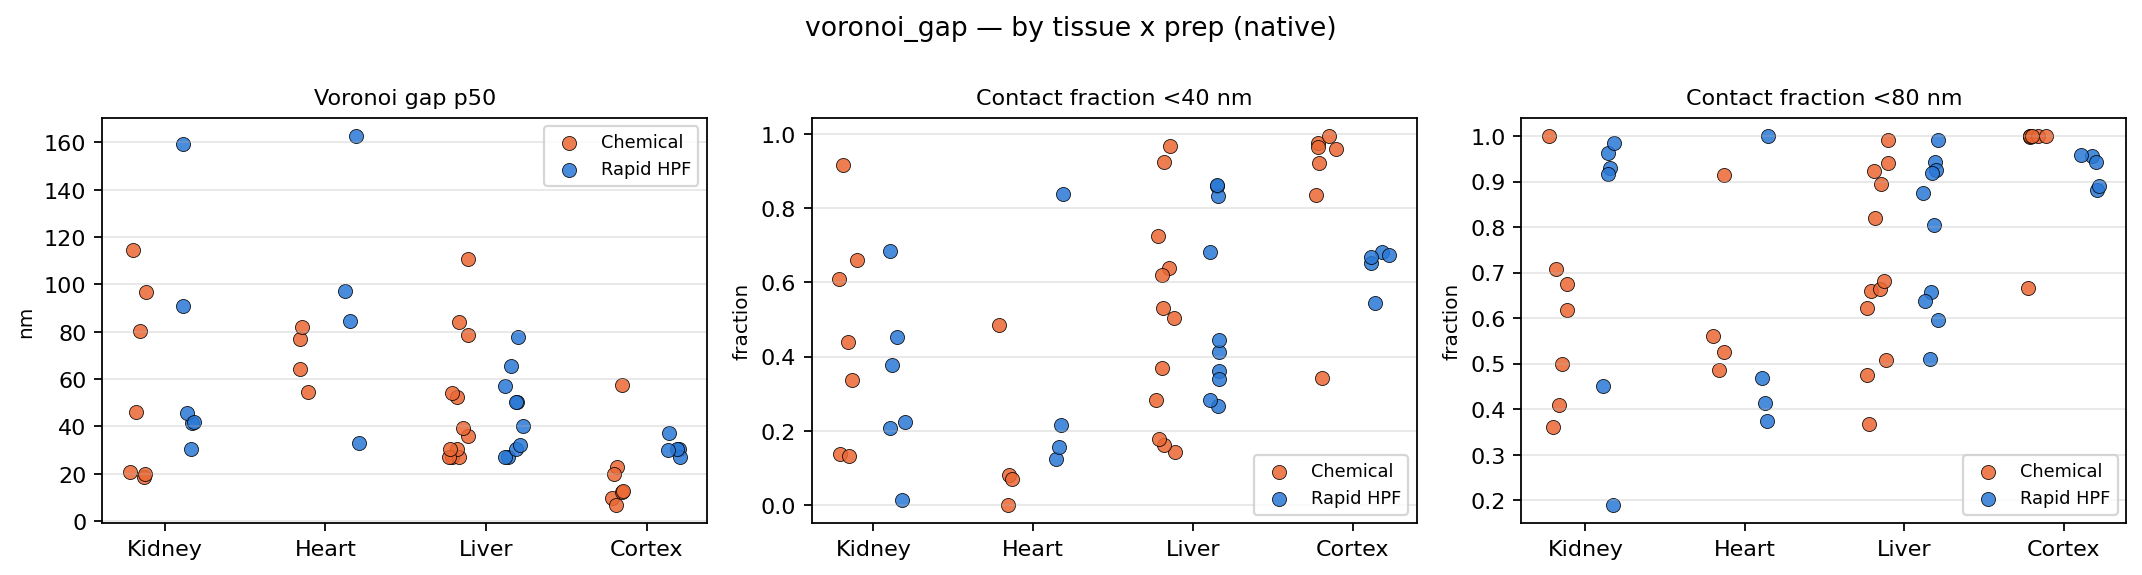 Full size ↗
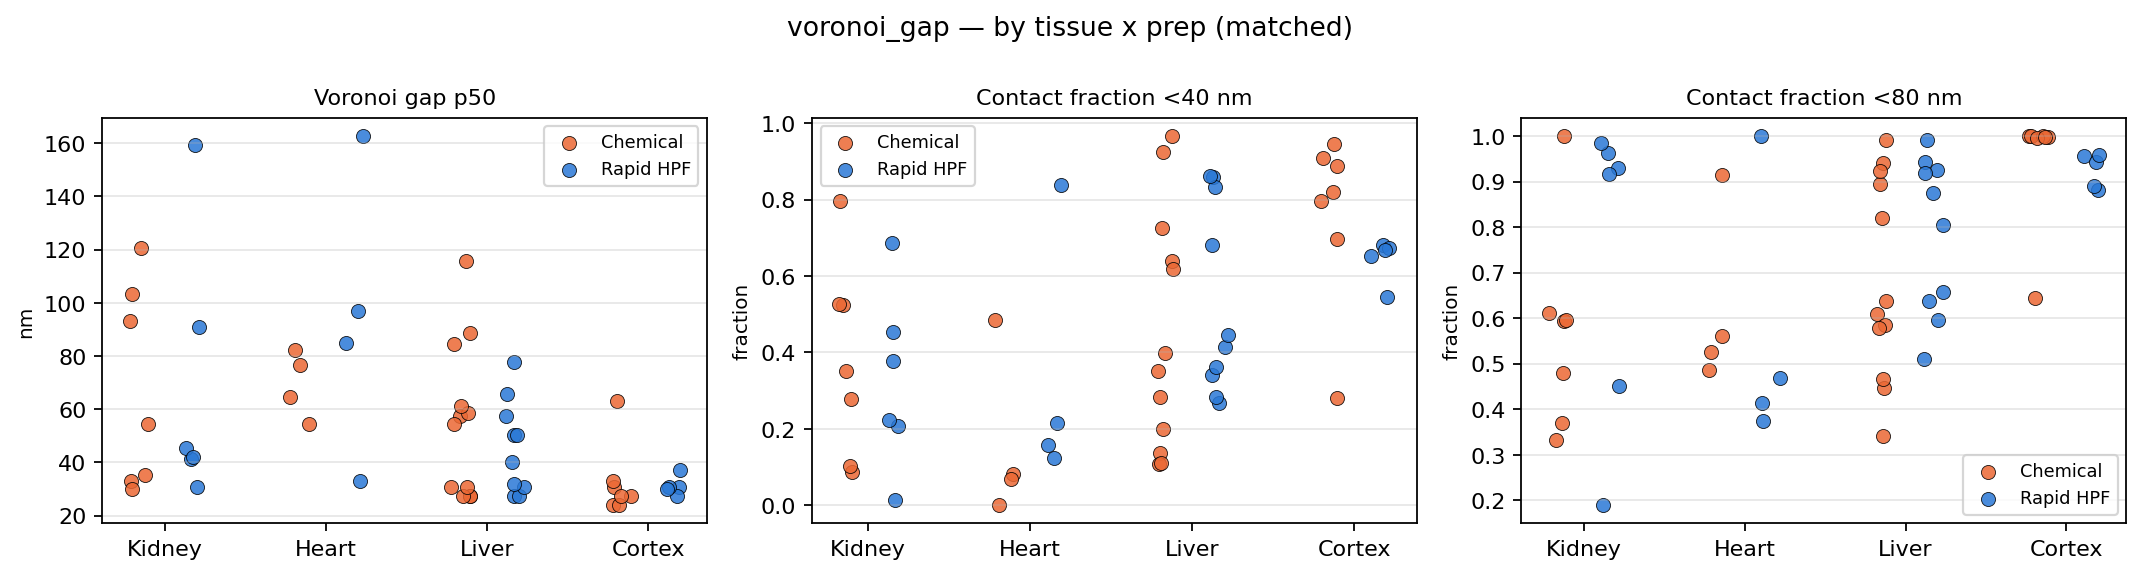 Full size ↗
Surface area to volume
ECS-facing membrane per unit cell volume, pooled across the cells in each crop.
Draw this live — any metric in the family, any grouping, one dot per crop.
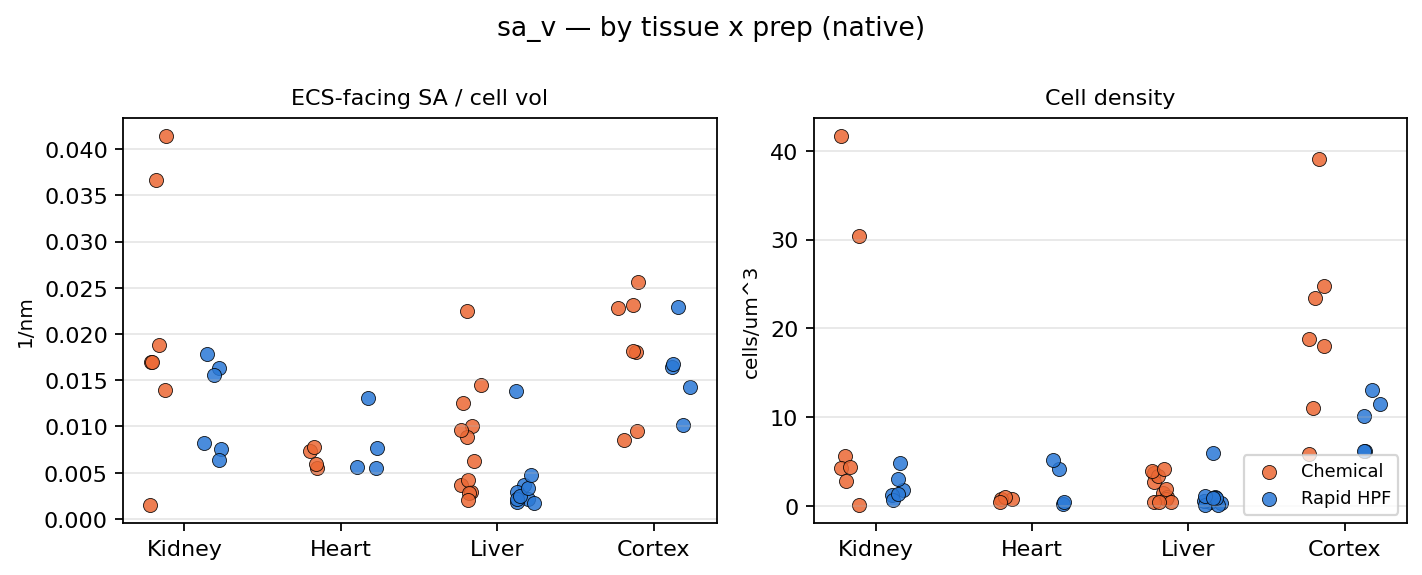 Full size ↗
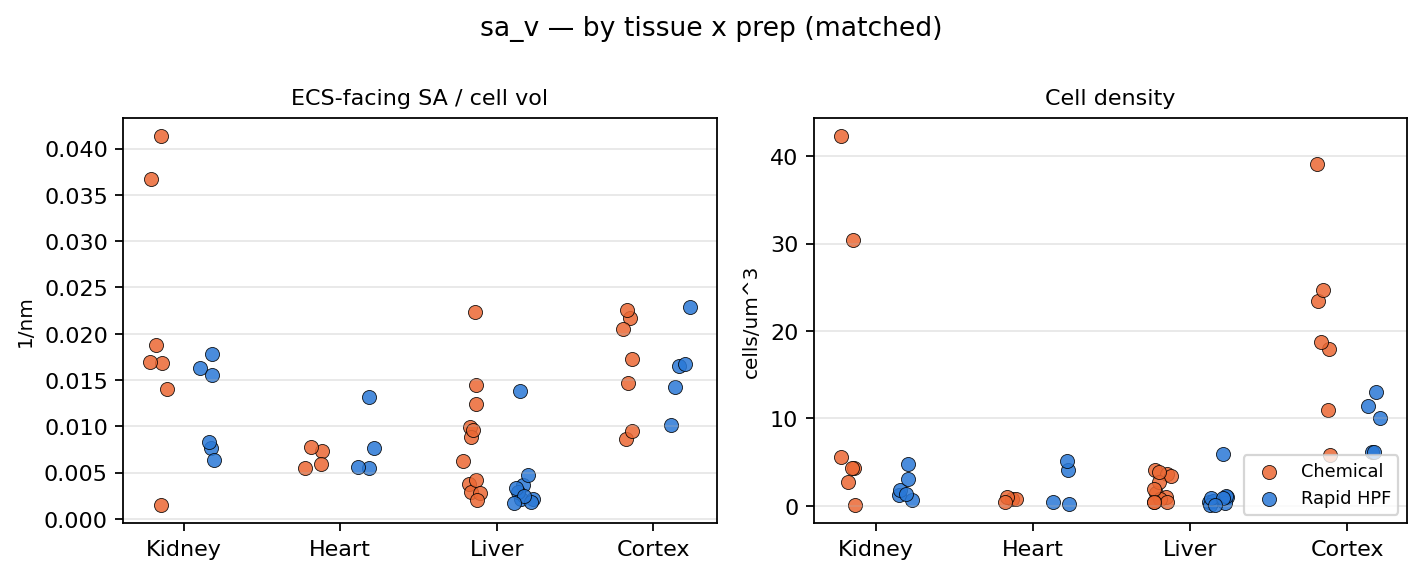 Full size ↗
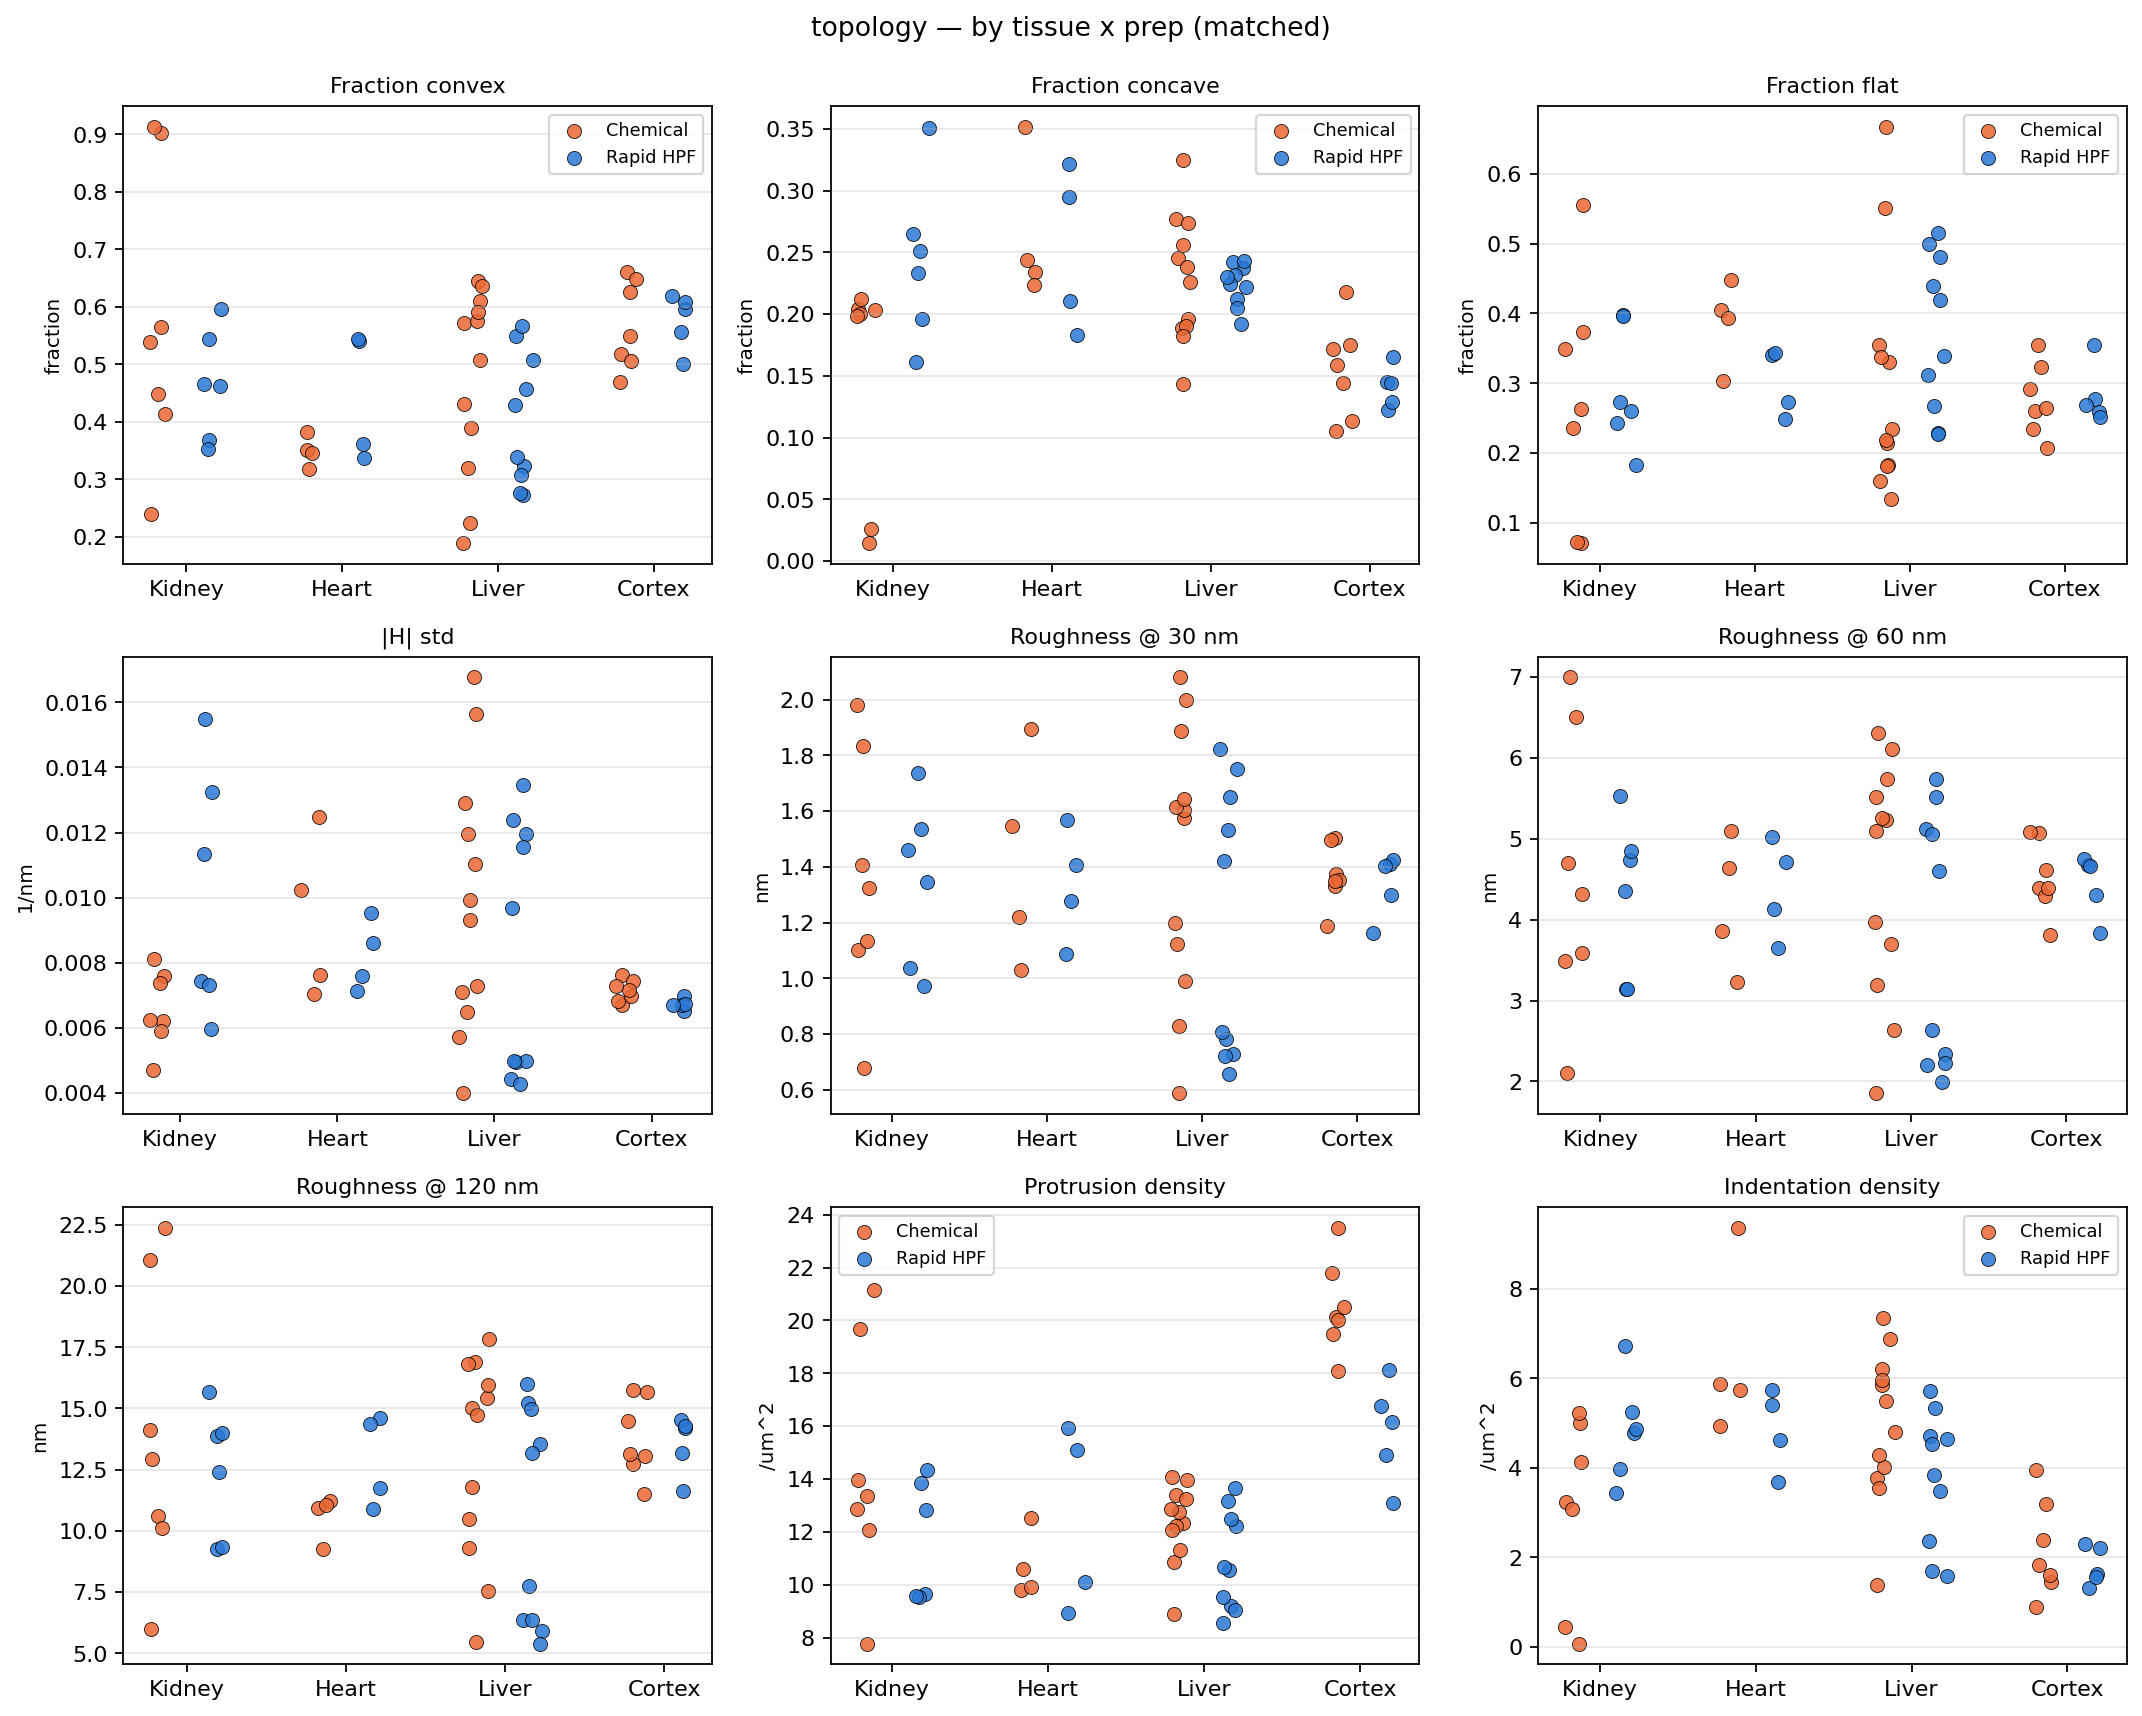
Membrane shape
Curvature, roughness and protrusion density on the ECS-facing membrane. The 30 nm roughness scale is not honestly resolvable in the matched panel.
Draw this live — any metric in the family, any grouping, one dot per crop.
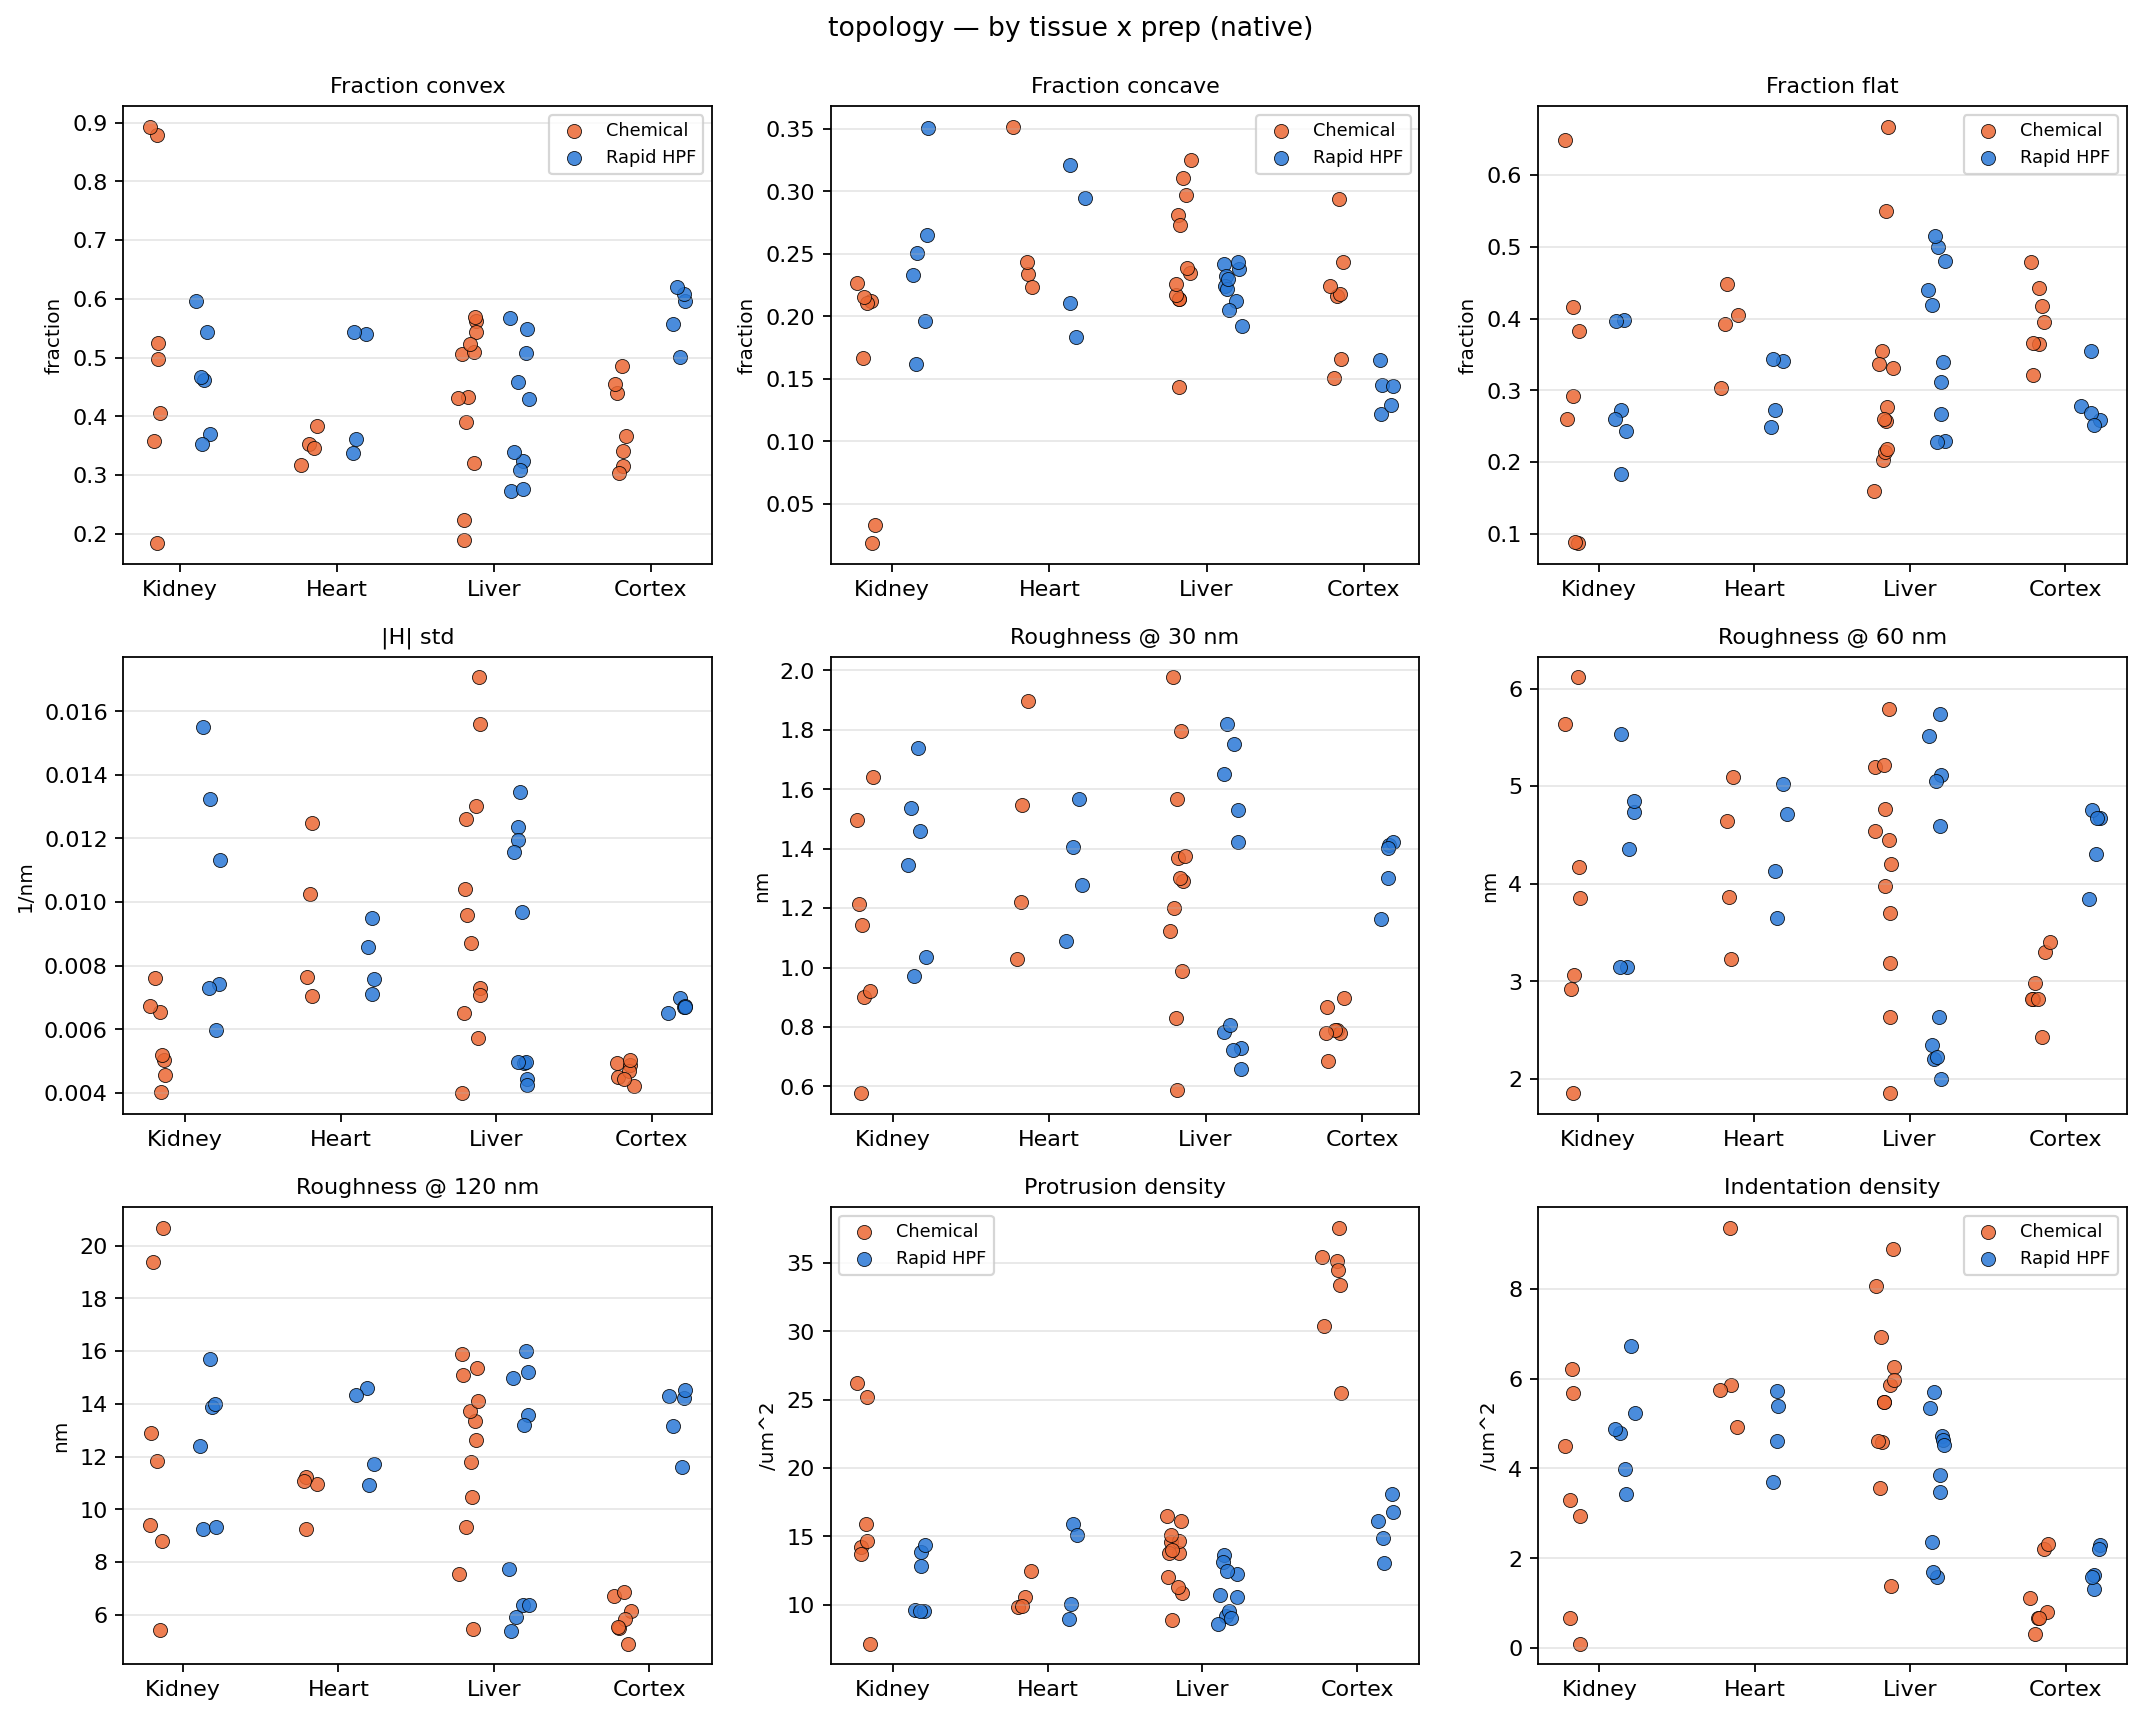 Full size ↗
 Full size ↗
The same crops, as numbers
Every crop behind the plot above, for the metric you have selected. Click a heading to sort; the ▾ on a column filters it; a crop name opens that crop in the 3D viewer.
Download every metric for every crop — one CSV, the same file this page reads.
Every metric at once
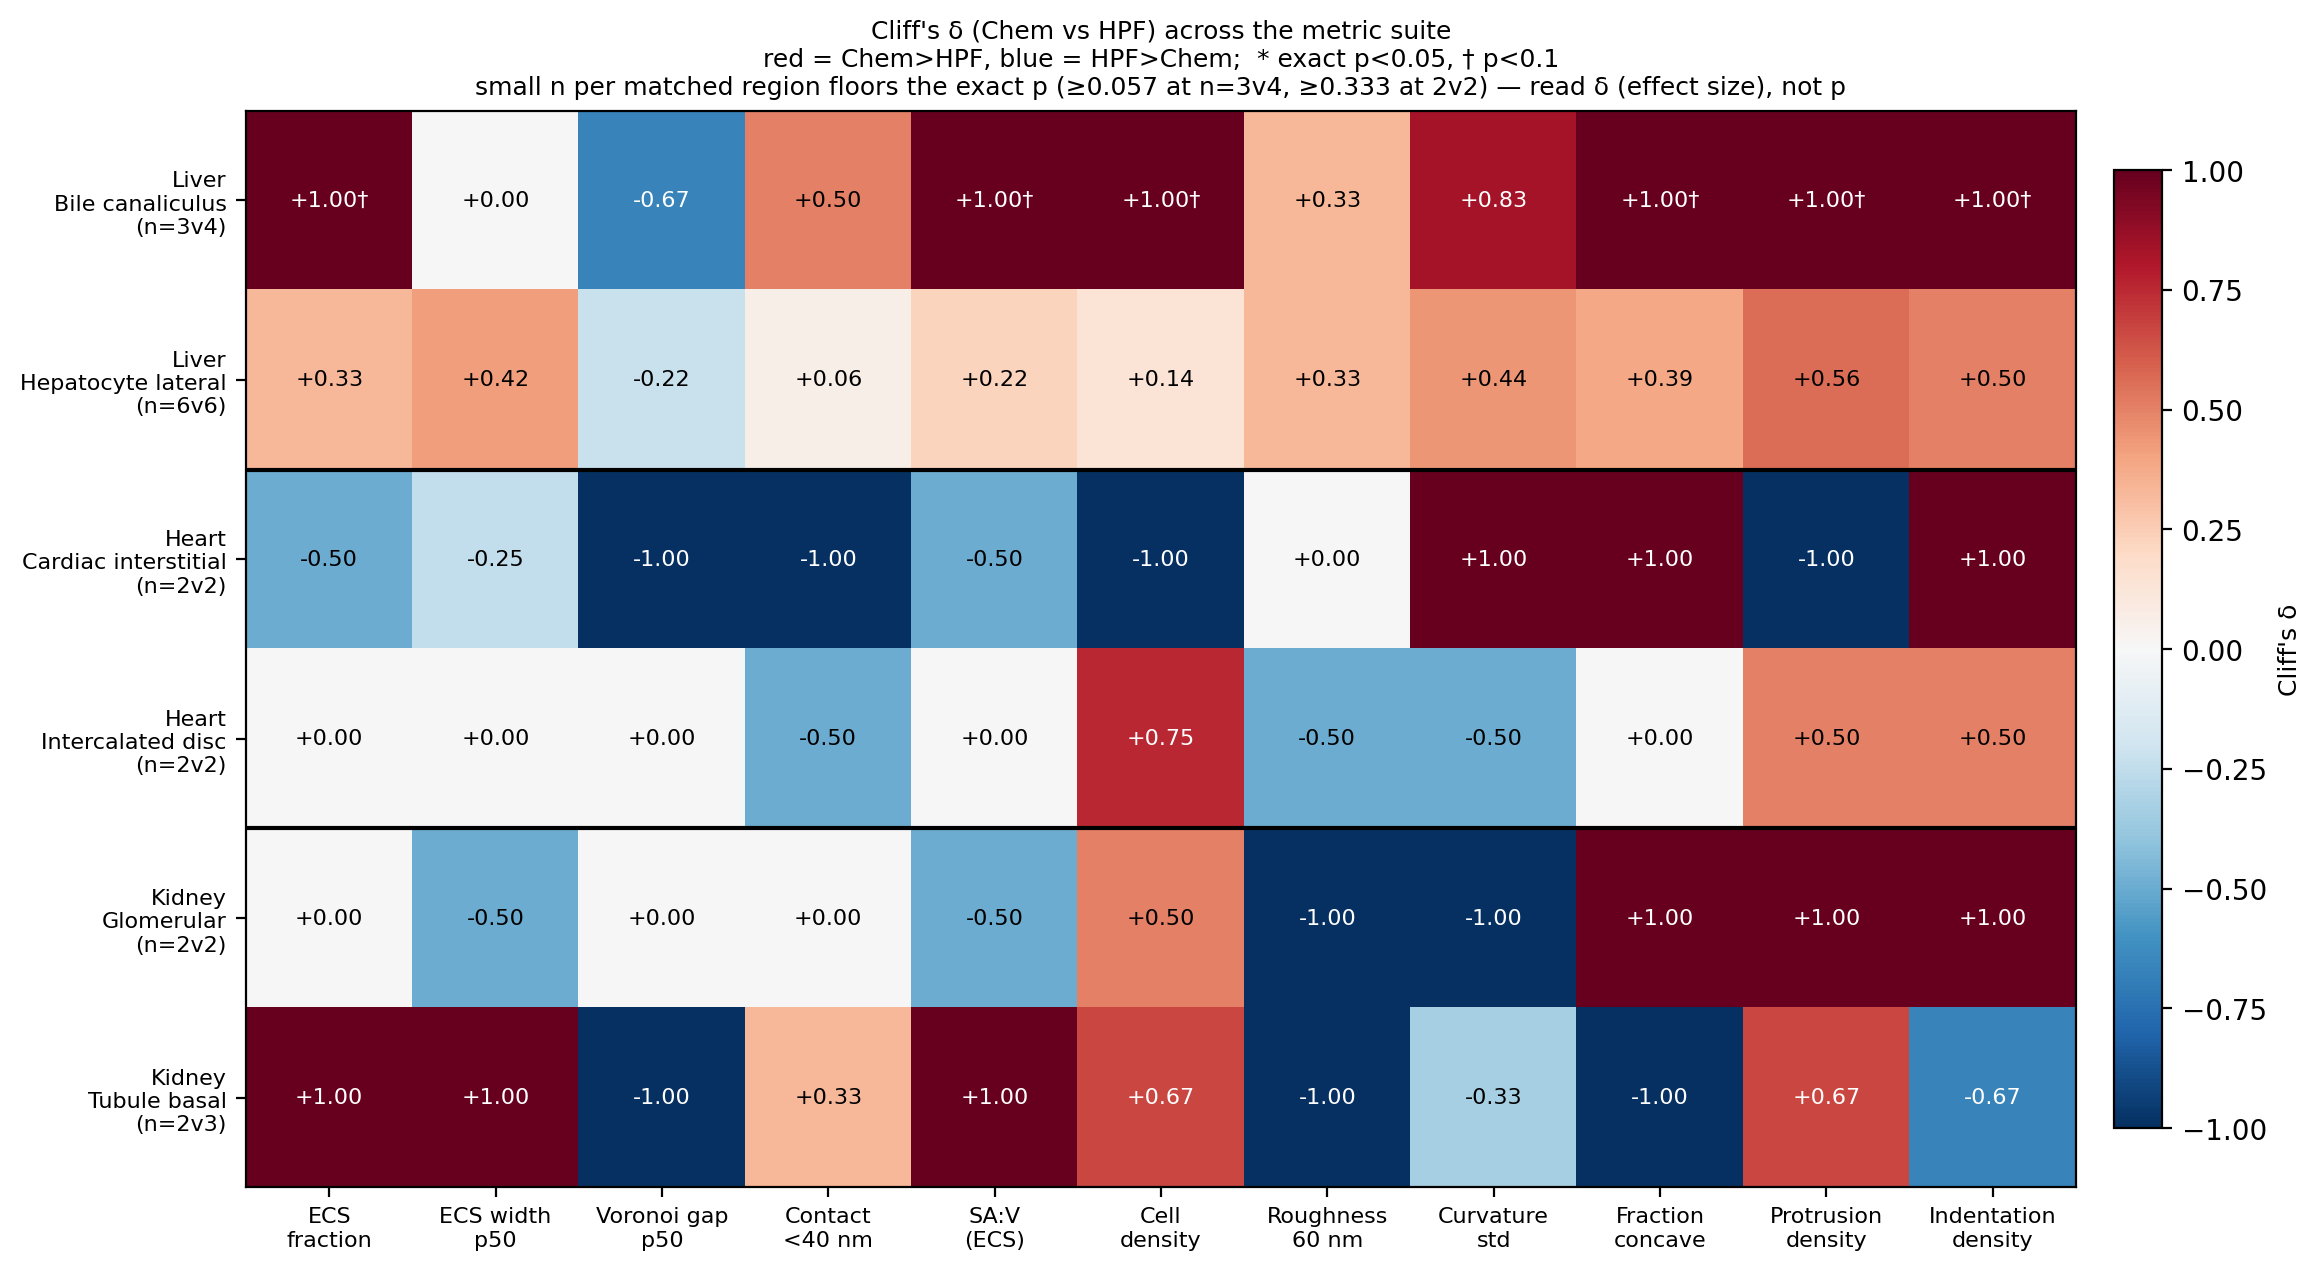
Standing panels, rendered by the pipeline rather than drawn in the page. These are the whole study on one sheet: the summary restricted to regions that have crops on both sides, the same again at a common 8 nm voxel, and the effect sizes behind both.
 Full size ↗
 Full size ↗
 Full size ↗
One region, every metric
The same comparison one anatomical region at a time. A region only appears here if both preparations have crops in it — six of them do.
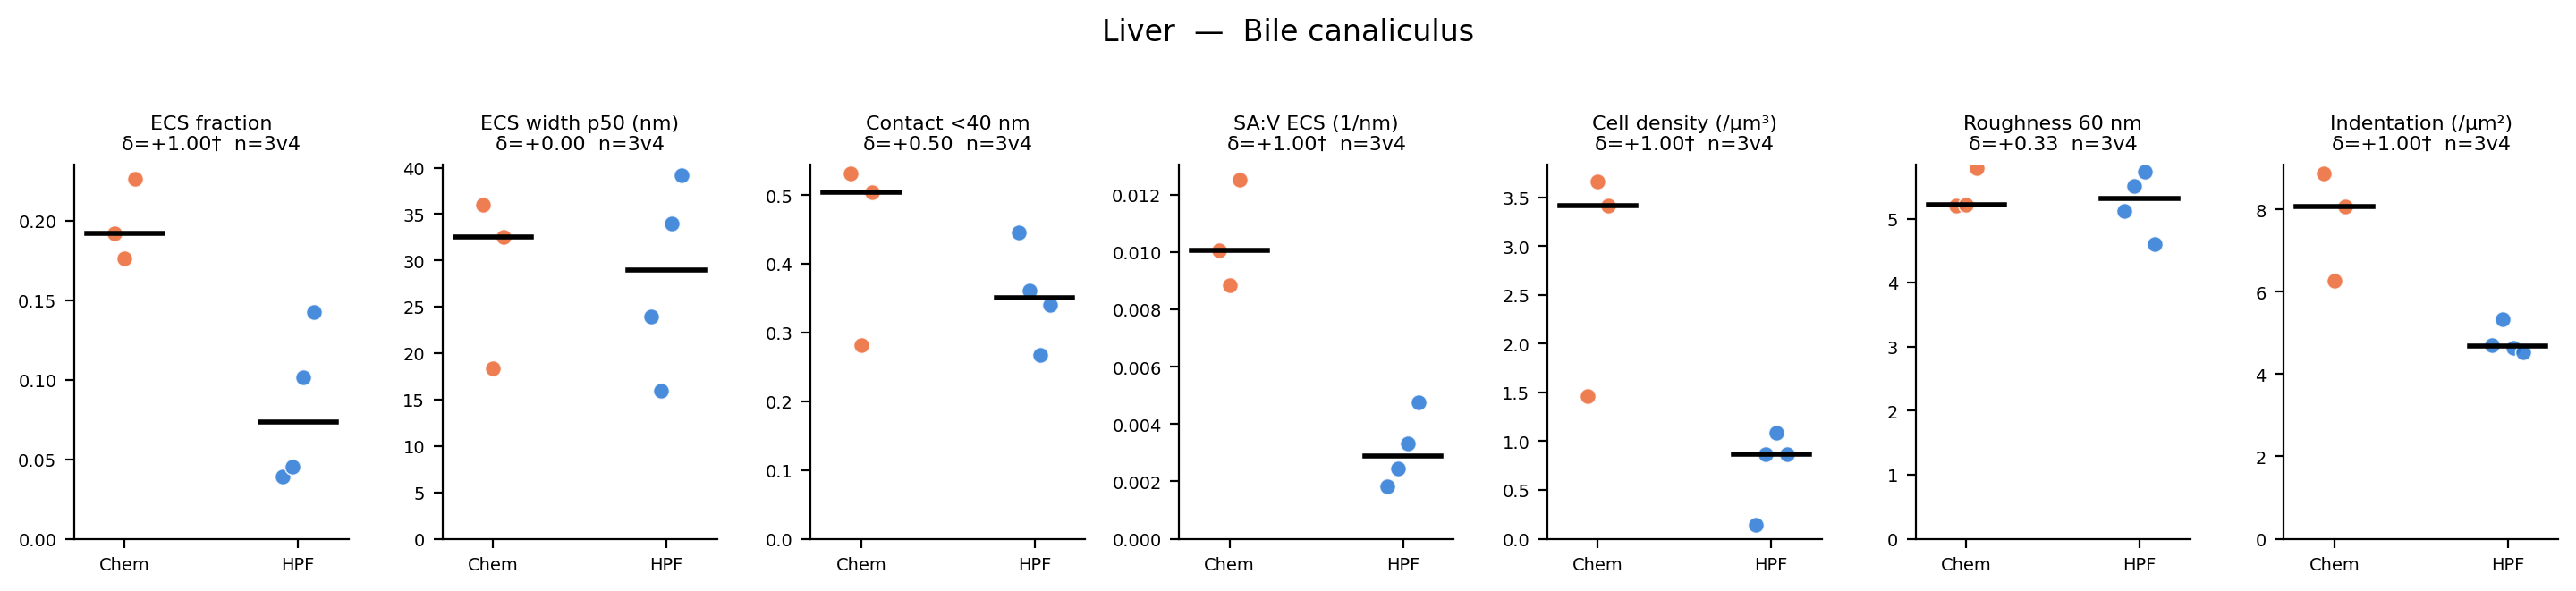 Full size ↗
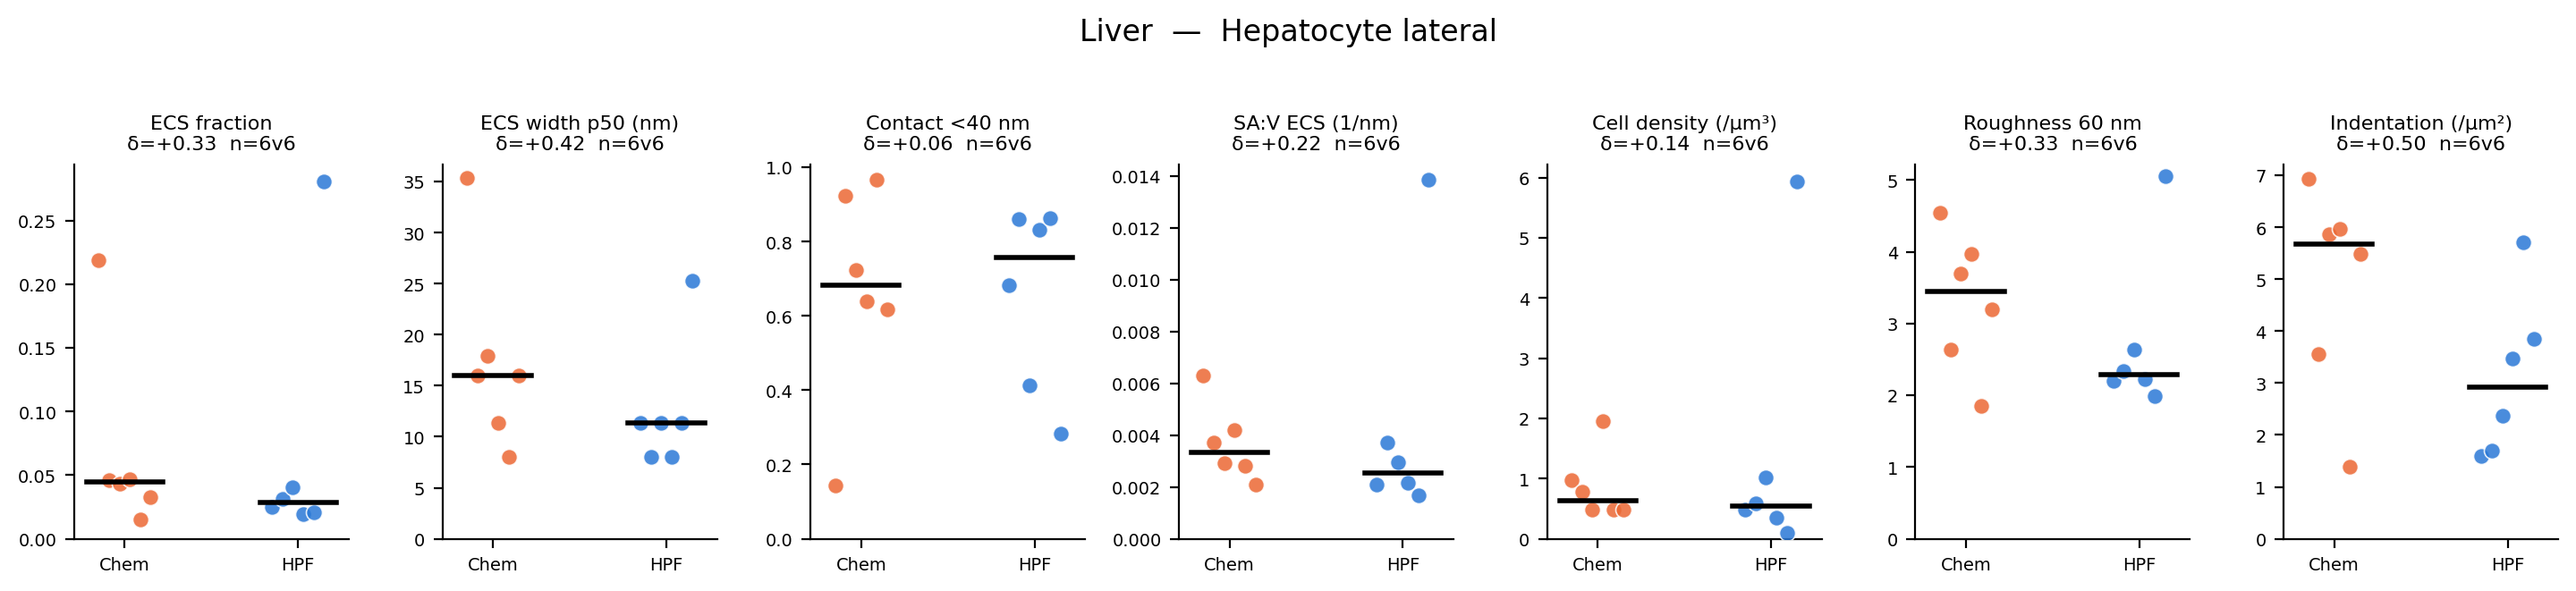 Full size ↗
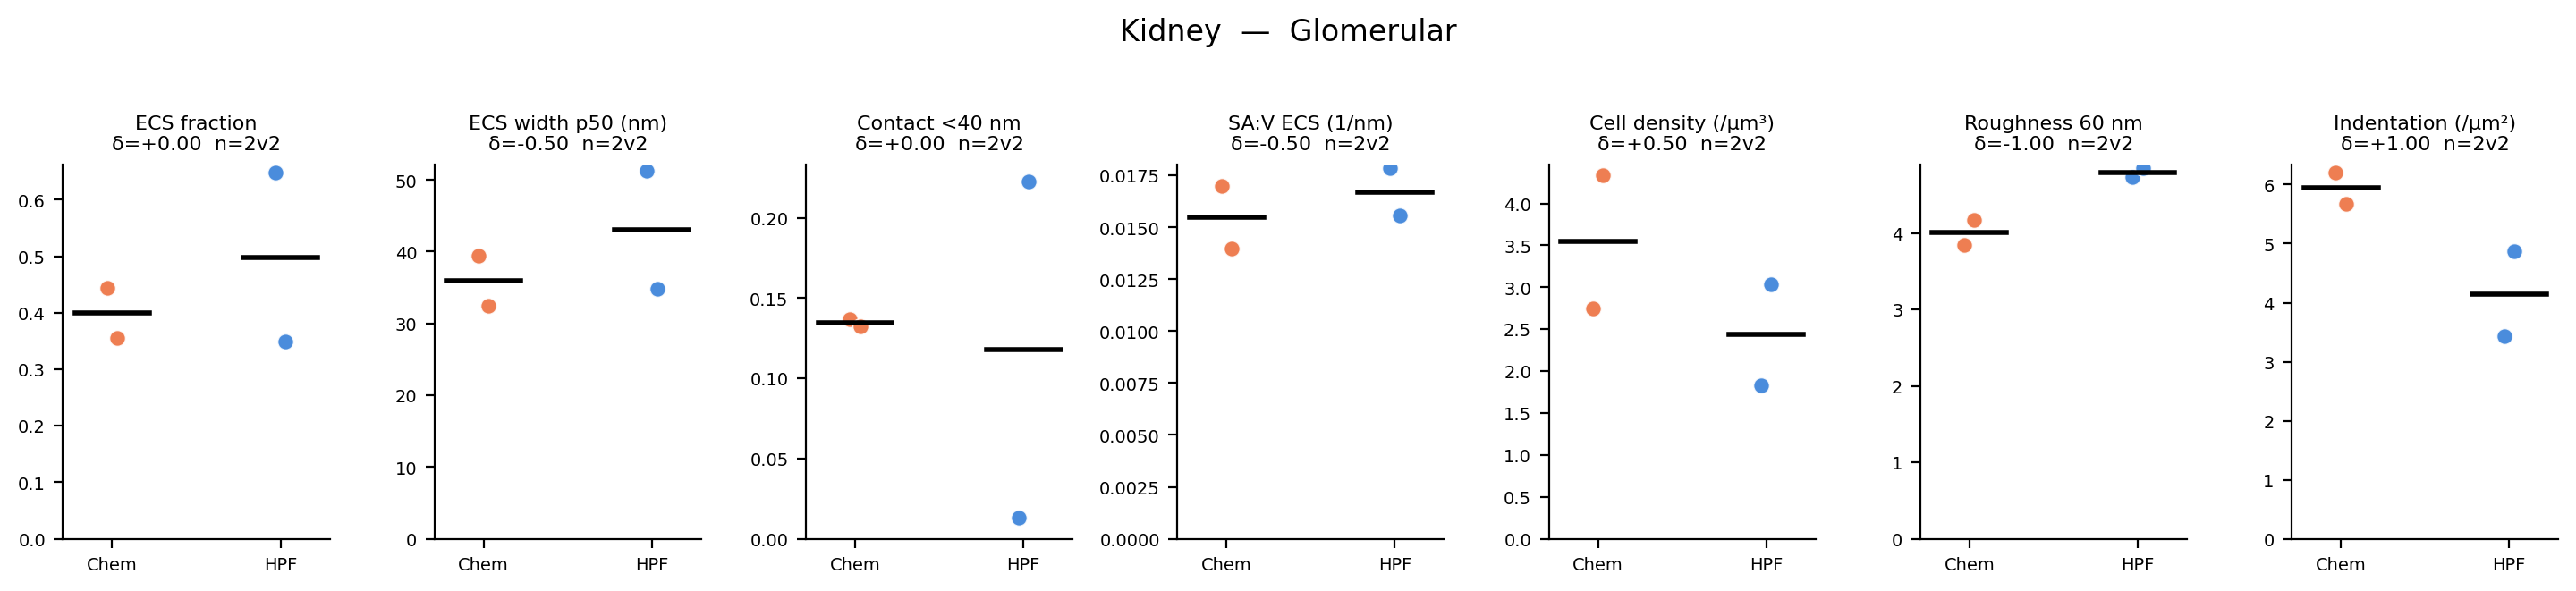 Full size ↗
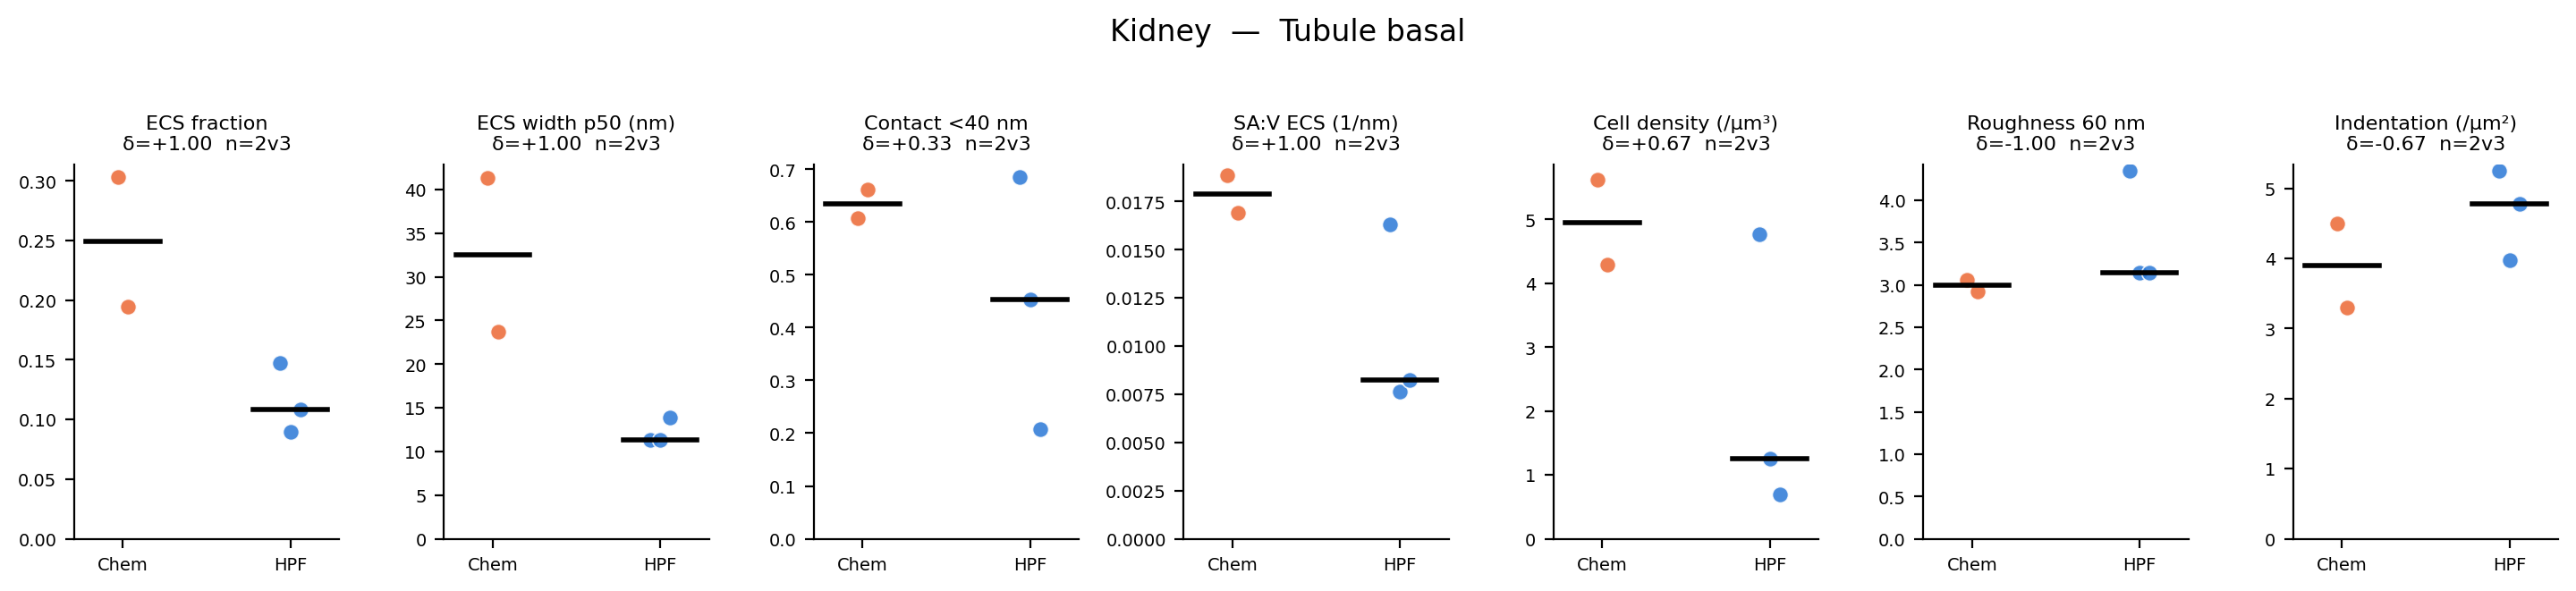 Full size ↗
 Full size ↗
 Full size ↗
Pictures of the geometry
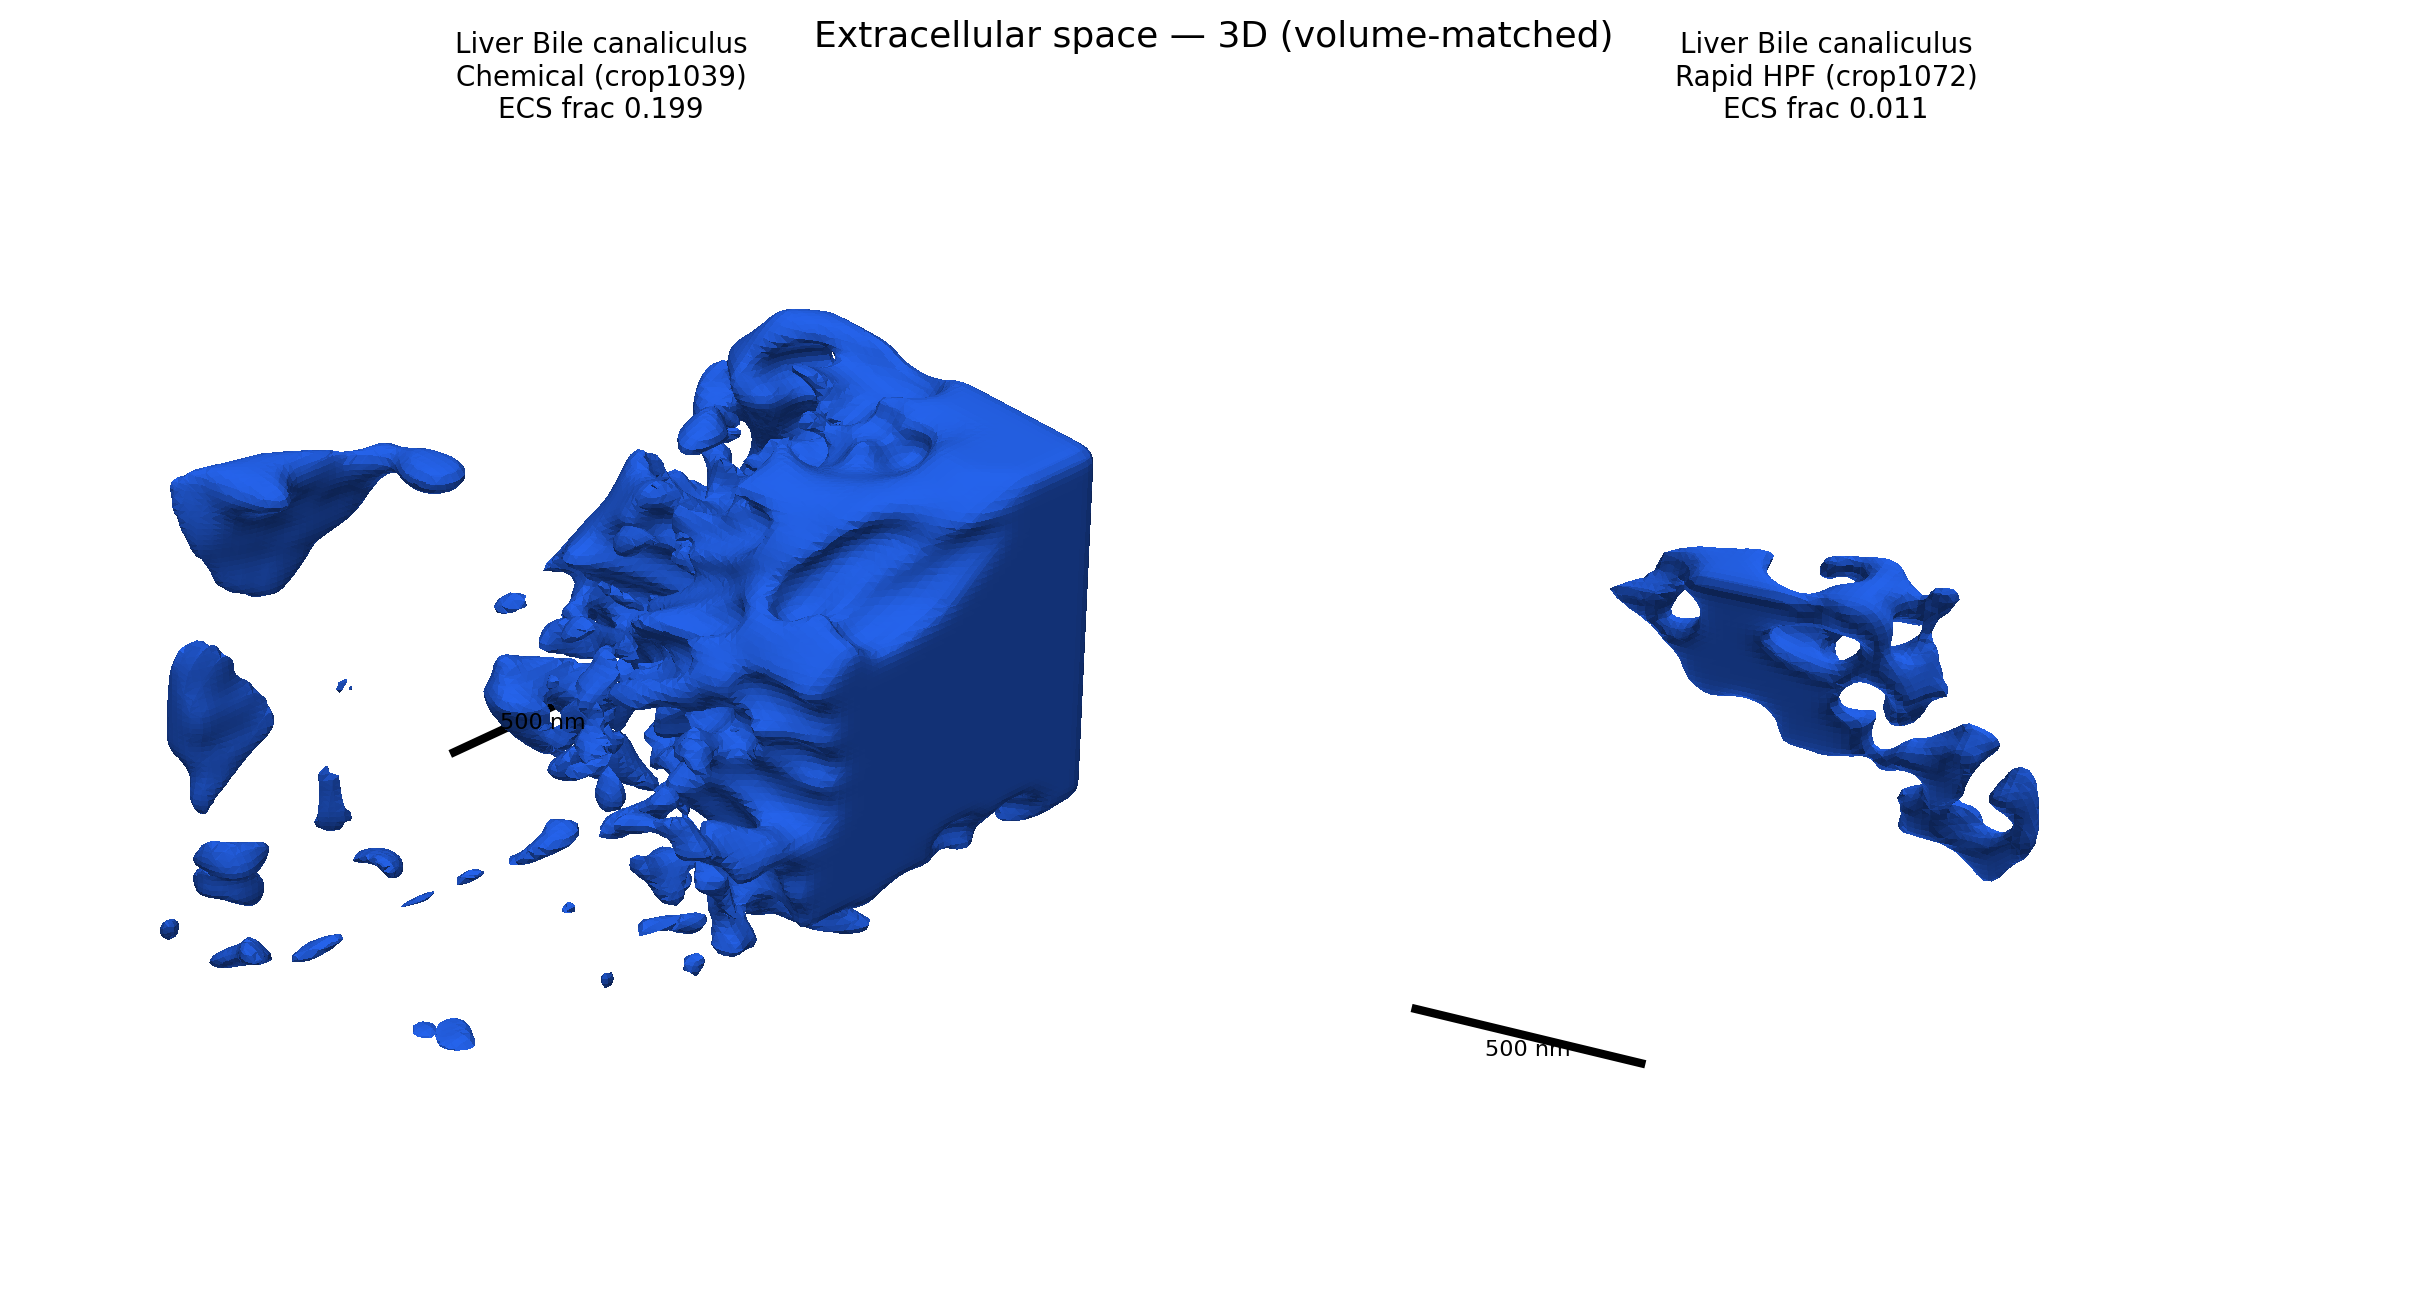
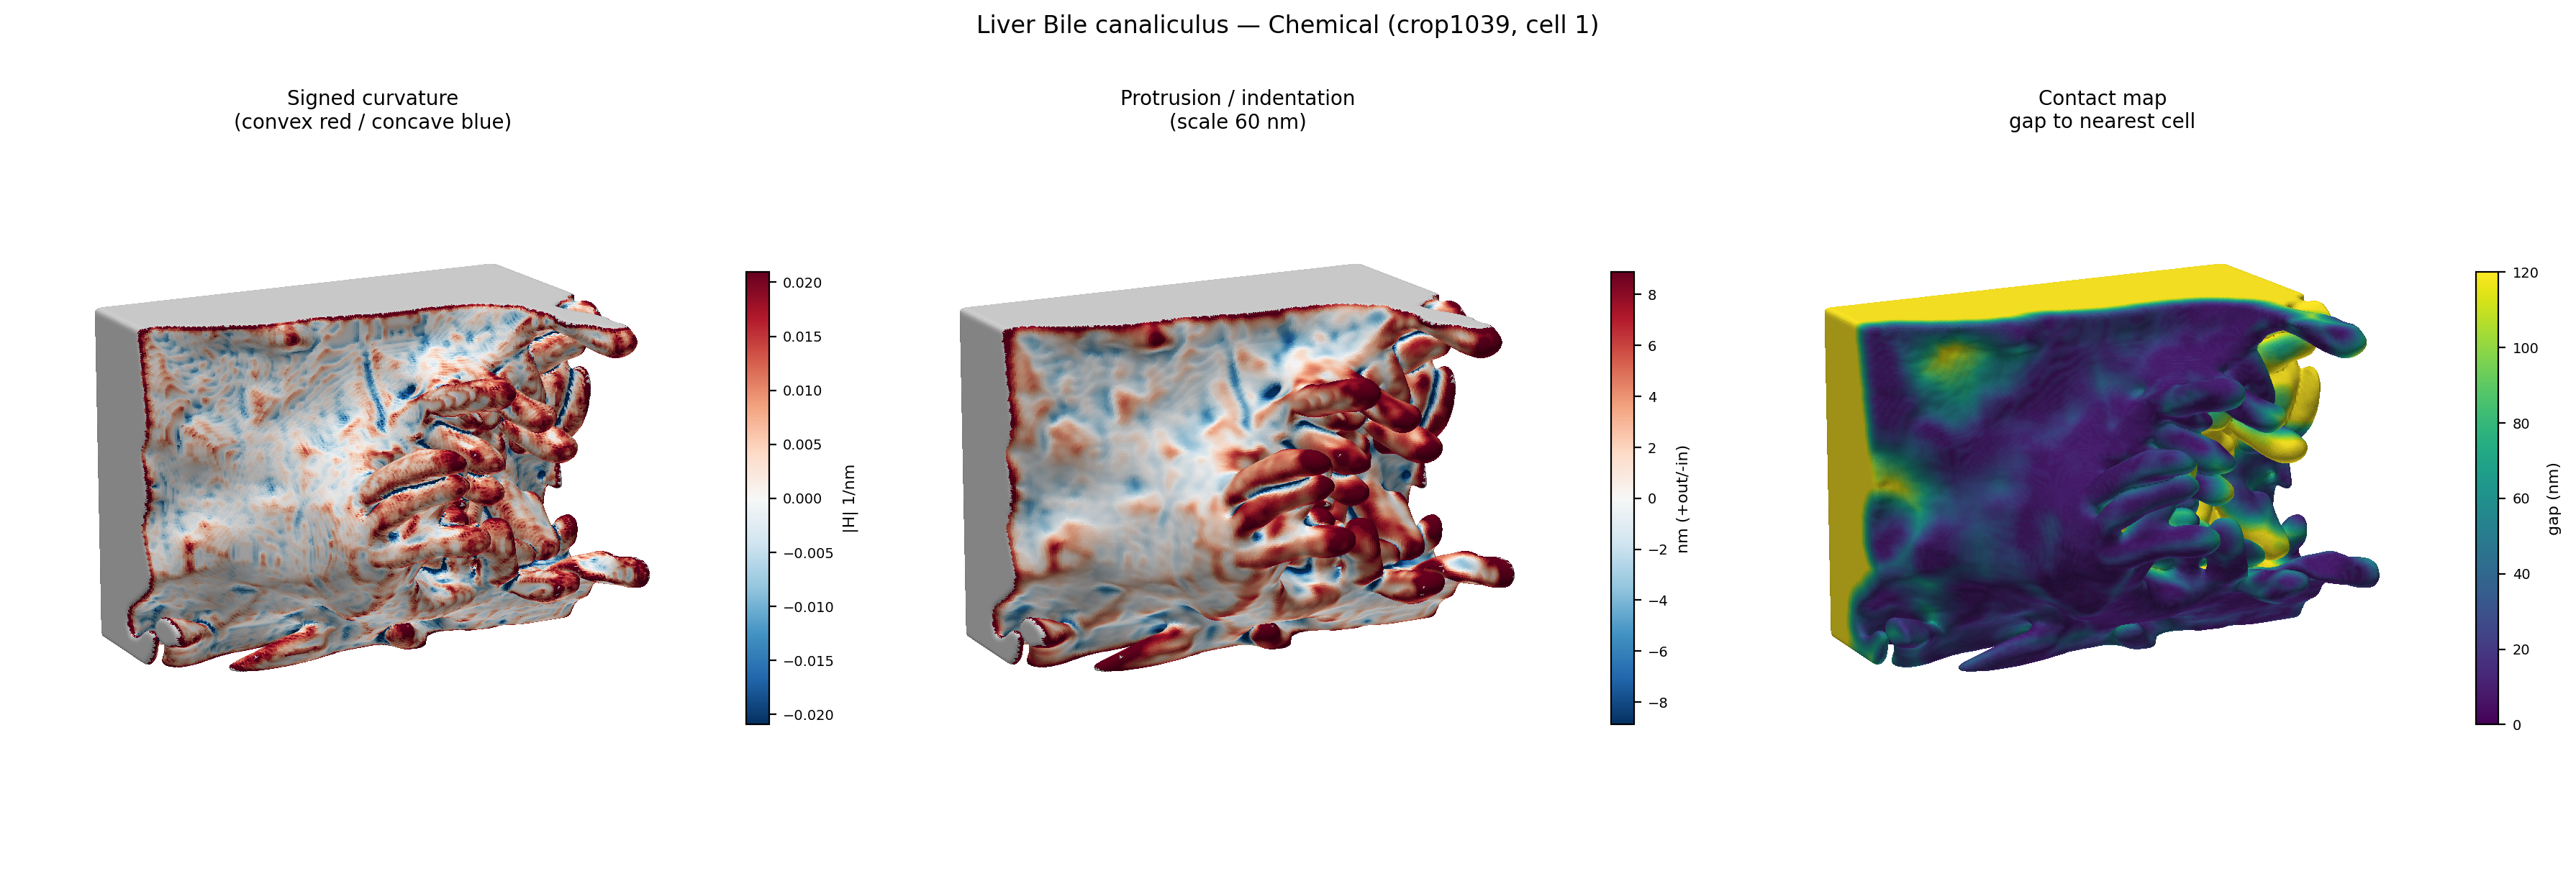
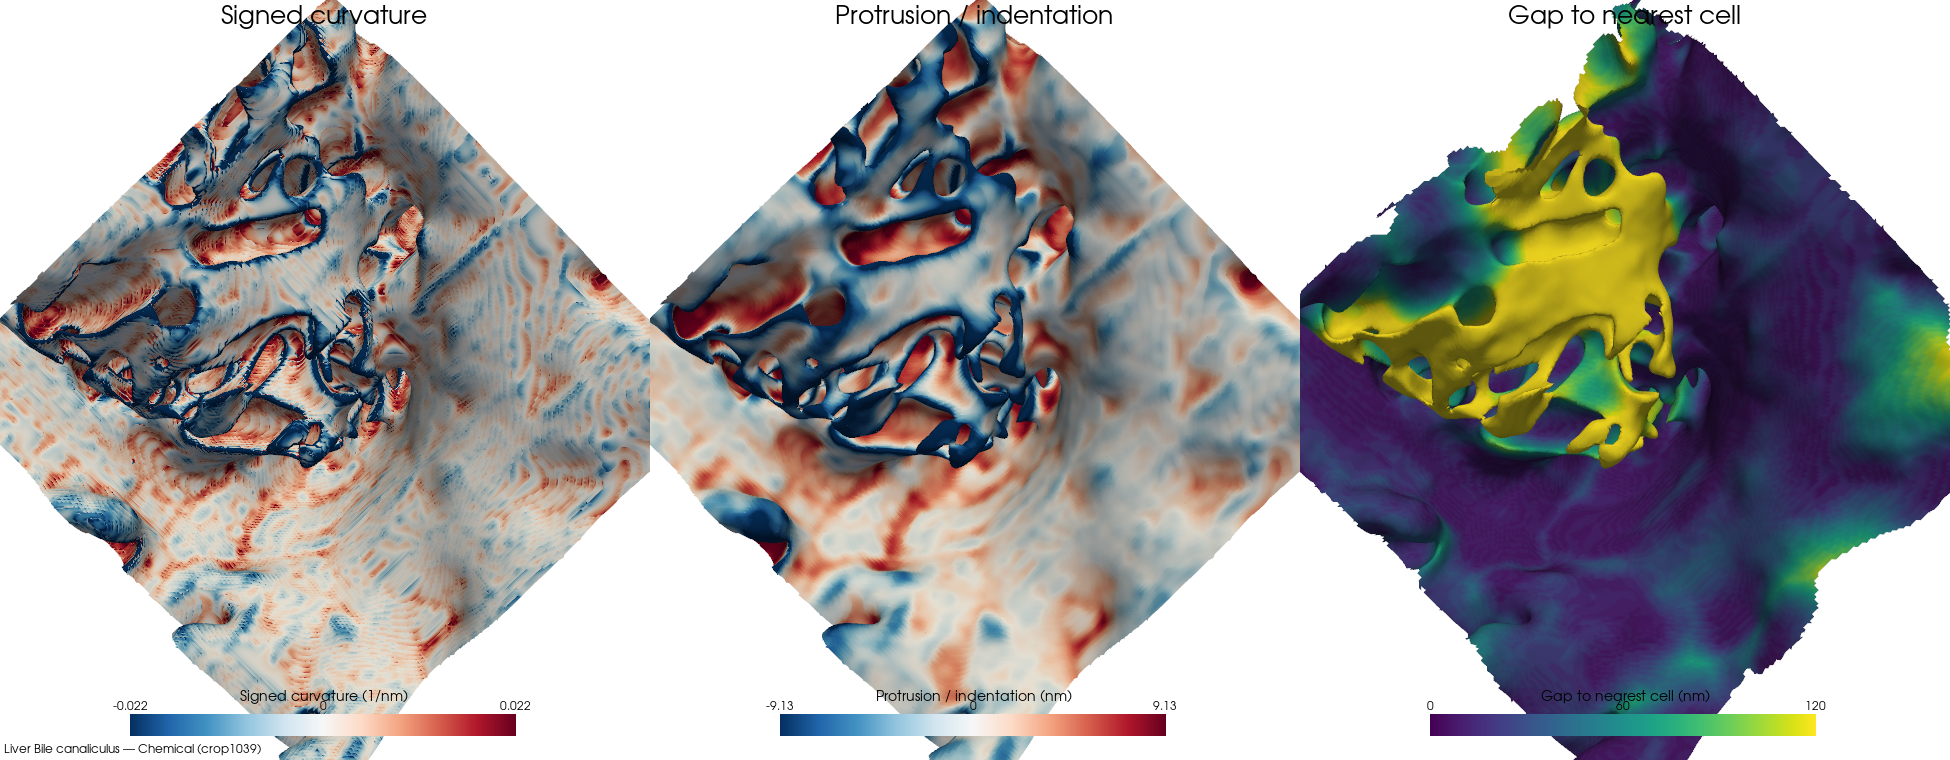
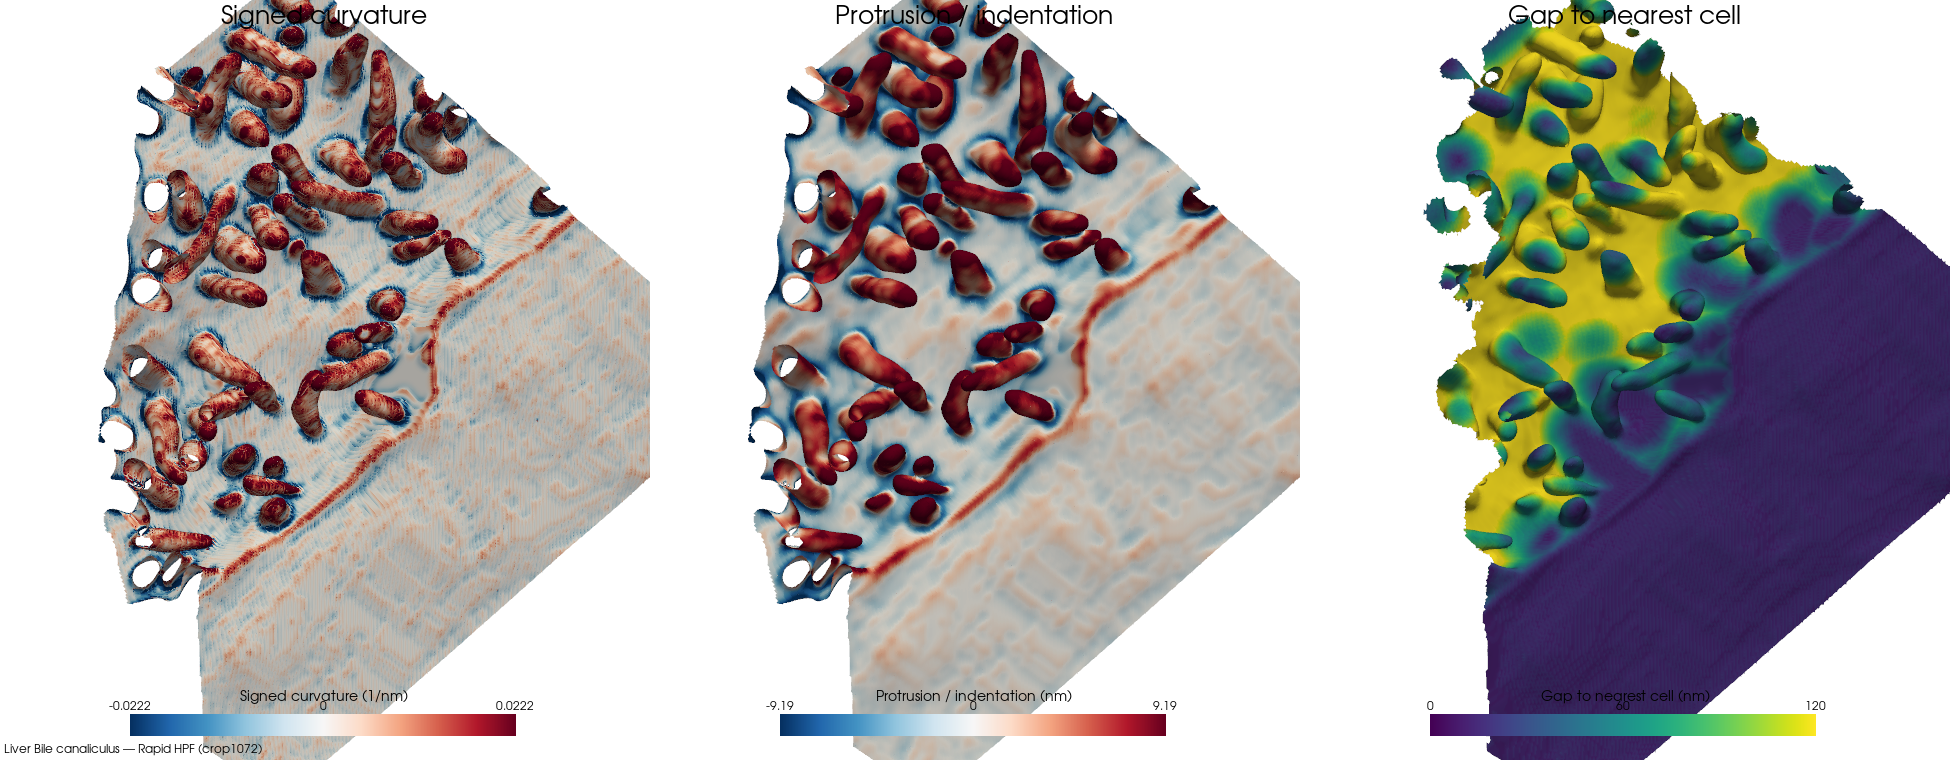
What the measurements are measuring. Membrane surfaces coloured by curvature, and the extracellular space rendered as the solid object it is.
These are stills. Paired 3D views puts one crop of each preparation side by side per region, and the crop page will load any two of the 55 into a viewer you can turn.
 Full size ↗
 Full size ↗
 Full size ↗
 Full size ↗
Where to next
- The 55 crops Every crop with its tissue, region and preparation — and a viewer that turns the extracellular space and the membrane in 3D.
- How this was measured What each metric is, where the resolution floors sit, and why the comparison is region-matched.
- The data One CSV, every metric for every crop, at both resolutions.